
Track your social media performance using Advanced Analytics in Social Planner. View engagement, reach, impressions, and post performance across connected social accounts from one dashboard.
This guide explains how to access analytics, understand available reports, compare social media performance, and identify the content that performs best.
TABLE OF CONTENTS
- What Are Advanced Analytics in the Social Planner?
- Key Benefits of Social Planner Advanced Analytics
- Where to Find Social Planner Advanced Analytics
- Supported Social Media Platforms and Limitations
- Filter by Platform and Account
- Available Reports and Metrics
- Important Considerations
- Frequently Asked Questions
- Related Articles
What Are Advanced Analytics in the Social Planner?
Advanced Analytics provides a centralized view of your social media performance across supported platforms. You can monitor engagement, compare account performance, and use reporting insights to improve your social media strategy.
Use Advanced Analytics to evaluate posting activity, understand content visibility, identify your highest-performing posts, and compare performance across social platforms.
Key Benefits of Social Planner Advanced Analytics
Advanced Analytics helps you understand audience engagement and identify opportunities to improve your social media content.
Comprehensive Social Media Insights: Track the number of posts, likes, comments, followers, impressions, and reach across supported social media platforms from one dashboard.
Visualize Your Social Post Performance: Use interactive graphs to review publishing trends and weekly performance.
Engagement Breakdown: View engagement metrics, including likes, comments, and shares, broken down by platform.
Platform Comparisons: Identify which platforms generate more engagement and use these insights to refine your content strategy.
Impressions and Post Reach: Measure your content's visibility using impressions and reach metrics.
Gender and Age Demographics: Review available audience demographics, including age groups and gender, to better understand your audience.
Note: Metric availability varies by platform. Some reports may not display data for every connected social account.
Where to Find Social Planner Advanced Analytics
To access the analytics dashboard:
Navigate to Marketing > Social Planner.
Click Statistics.
Review the available analytics reports.
Use the account and platform filters to narrow the displayed results.
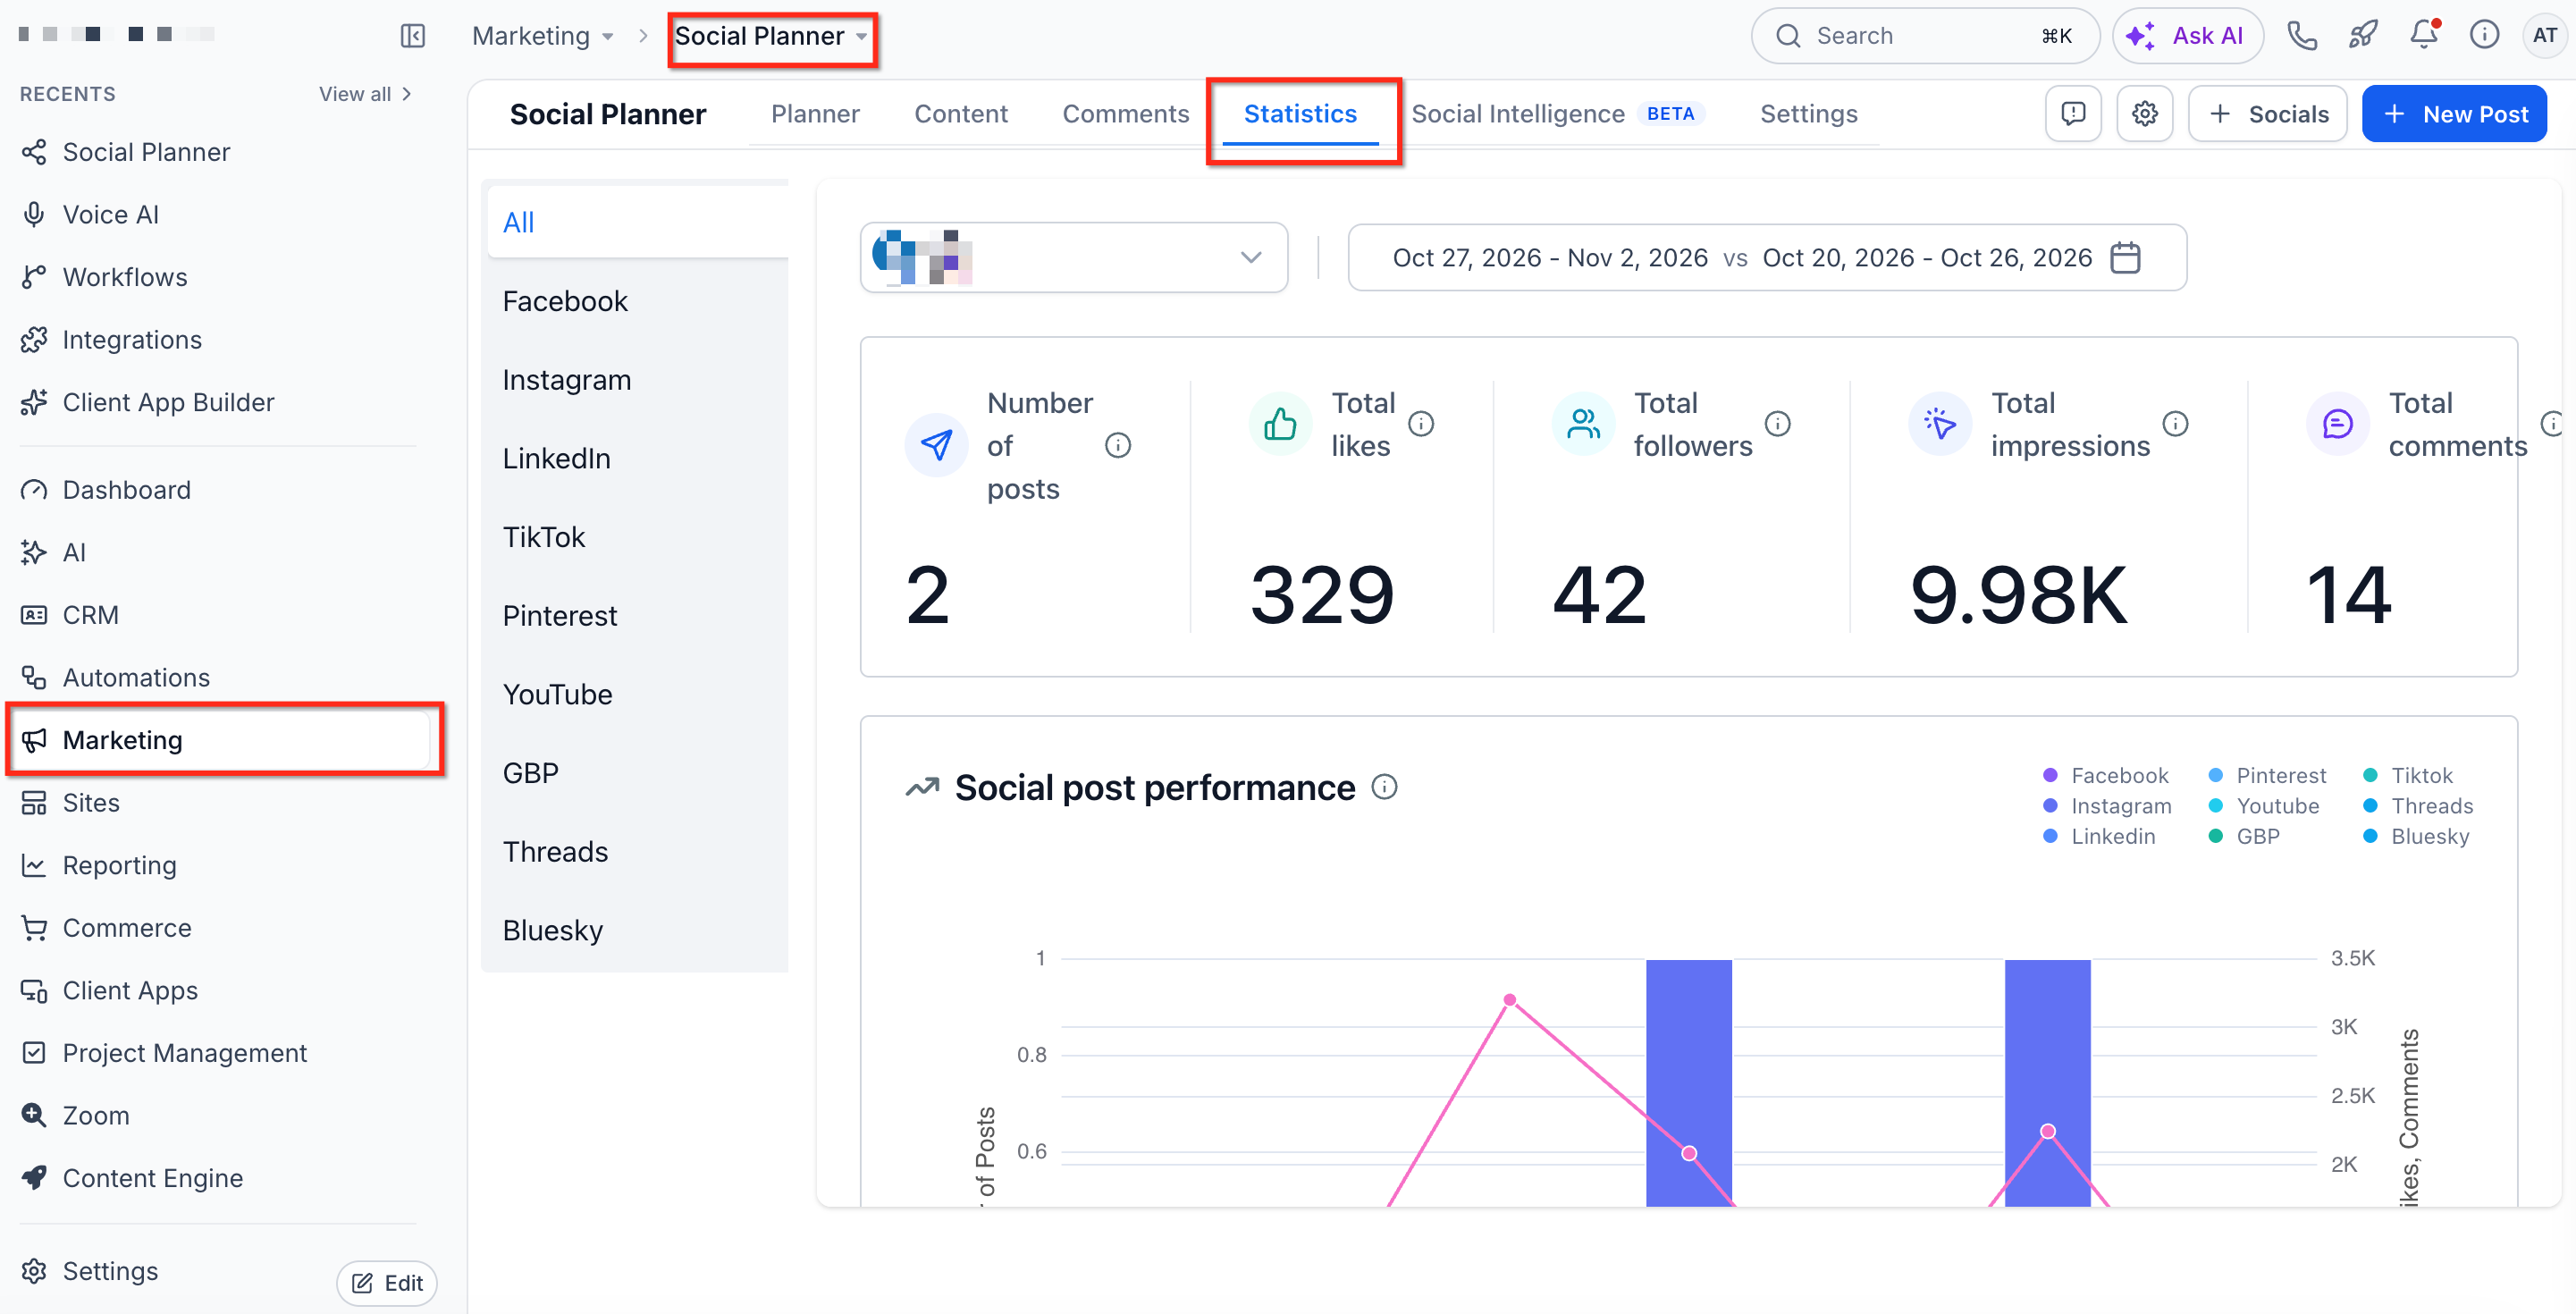
The Statistics dashboard displays available social performance metrics for your connected accounts.
Supported Social Media Platforms and Limitations
Advanced Analytics supports several social media platforms. However, available metrics and reporting frequency vary based on platform API capabilities, account types, and permissions.
Supported Platforms
Facebook
Instagram
LinkedIn
YouTube
Pinterest
TikTok
Google Business Profile (GBP)
Threads
Bluesky
Permissions and Reauthentication Alerts
Some connected social accounts may require updated permissions to continue providing analytics.
When an account requires reauthentication, an alert appears so you can reconnect the account and restore access to available reporting data.
After reconnecting an account with the required permissions, updated statistics may become available the following day, depending on the platform.
Important: Reconnect affected social accounts when prompted to help maintain access to analytics data.
Post-Specific Statistics
Post-specific statistics are available in the post details window within the Social Planner List View.
Supported platforms:
Facebook
Instagram
TikTok Personal
LinkedIn Pages
Platforms identified for future support:
YouTube
Pinterest
Platforms not supported for post-specific statistics:
Google Business Profile
TikTok Business
LinkedIn Profiles
Communities
Note: Post-specific statistics and the Statistics dashboard have different platform requirements.
Platform-Specific Notes
TikTok
The Statistics dashboard supports TikTok Business profiles.
Analytics data may take one or two days to appear because of TikTok API availability.
Post-specific statistics support TikTok Personal accounts.
Analytics may reflect data with a two-day delay due to Pinterest API constraints.
Data for the current day and the previous day may not be complete.
Dashboard analytics support LinkedIn Pages.
LinkedIn personal profiles are not supported for dashboard analytics because of API restrictions.
Follower data may have a two-day reporting delay.
Threads
Post Reach is not supported.
Audience demographic data is unavailable.
Advanced engagement breakdowns are limited.
Most metrics may have a one-day reporting delay, excluding post counts.
Bluesky
Post Reach is not supported.
Follower-related reporting and demographic data are limited.
Advanced engagement breakdowns are unavailable.
Most metrics may have a one-day reporting delay, excluding post counts.
Note: Demographic reporting is not available for all supported social platforms.
Metric Availability by Platform
The following table shows metric availability by platform as documented for the Statistics dashboard.
✅ Supported ❌ Not supported
| Metric | YouTube | TikTok | GBP | Threads | Bluesky | ||||
|---|---|---|---|---|---|---|---|---|---|
| Number of Posts | ✅ | ✅ | ✅ | ✅ | ✅ | ✅ | ❌ | ✅ | ✅ |
| Likes | ✅ | ✅ | ✅ | ✅ | ❌ | ✅ | ❌ | ✅ | ✅ |
| Comments | ✅ | ✅ | ✅ | ✅ | ❌ | ✅ | ❌ | ✅ | ✅ |
| Followers | ✅ | ✅ | ✅ | ✅ | ❌ | ✅ | ❌ | ✅ | ✅ |
| Impressions | ✅ | ✅ | ✅ | ❌ | ✅ | ✅ | ✅ | ✅ | ❌ |
| Post Reach | ✅ | ✅ | ✅ | ✅ | ❌ | ❌ | ✅ | ❌ | ❌ |
| Engagement | ✅ | ✅ | ✅ | ✅ | ❌ | ✅ | ❌ | ✅ | ✅ |
| Top Performing Posts | ✅ | ✅ | ✅ | ✅ | ✅ | ✅ | ❌ | ❌ | ❌ |
| Gender Demography | ❌ | ✅* | ❌ | ❌ | ❌ | ❌ | ❌ | ❌ | ❌ |
Instagram demographic reporting requires at least 100 followers. Follower-related statistics may be limited for accounts below this threshold.
Important: Reporting availability depends on the connected account and the data provided by each social platform.
Filter by Platform and Account
Use the available filters to focus on specific social accounts or compare performance across supported platforms.
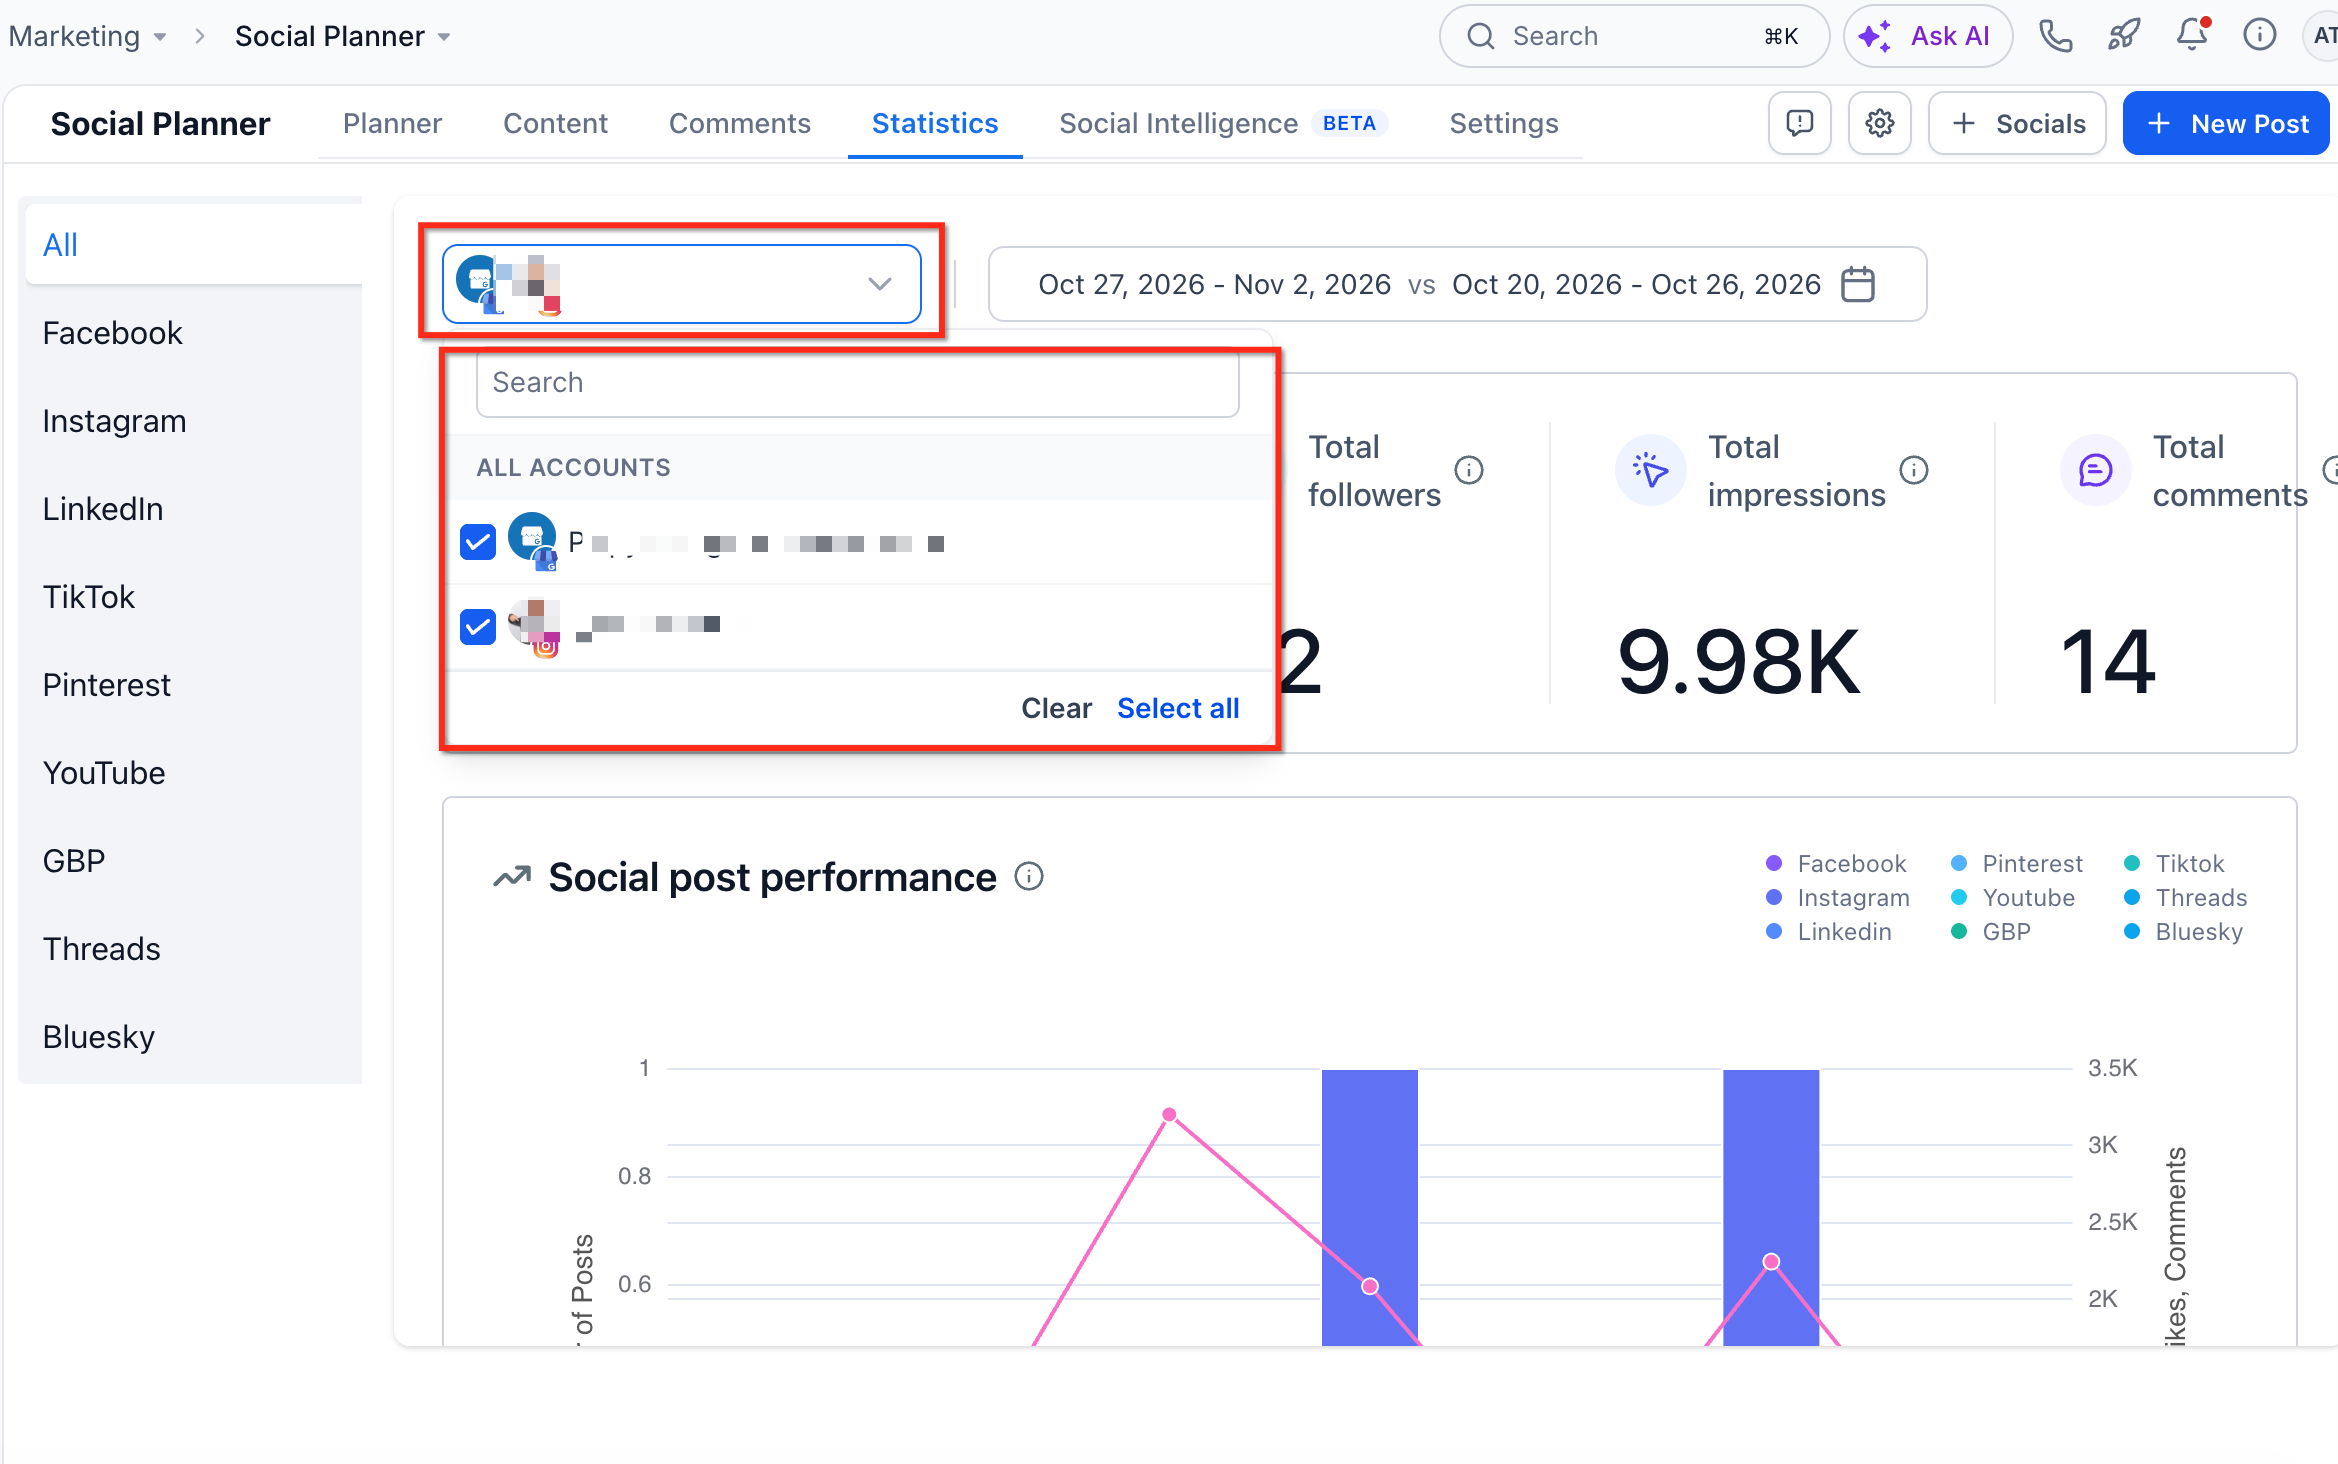
Filter by Social Account
Open the account dropdown in the upper-left corner of the analytics dashboard.
Select the checkboxes for the social accounts you want to include.
Review the updated metrics for the selected accounts.
You can select multiple accounts to compare combined performance.
Filter by Social Platform
Use the platform selector on the left side of the dashboard to filter analytics by social network.
Select All to view combined metrics across supported platforms.
Select an individual platform to view its available analytics.
Switch between platforms to compare performance.
For example, select Threads or Bluesky to review metrics available for those platforms.
Available Reports and Metrics
The Statistics dashboard includes multiple reports for monitoring social media activity, audience engagement, and post performance.
Tip: Hover over the information icon (i) beside a metric to review its definition, supported platforms, and reporting details.
KPI Overview
The KPI Overview provides a summary of key social media metrics across your selected accounts.
Available metrics include:
Number of Posts: The total number of posts published across selected social accounts.
Total Likes: The total number of likes received on published posts across selected accounts.
Total Followers: The total follower count reported across selected social accounts.
Impressions: The total number of times published content was displayed across selected social accounts.
Comments: The total number of comments received on published posts across selected social accounts.
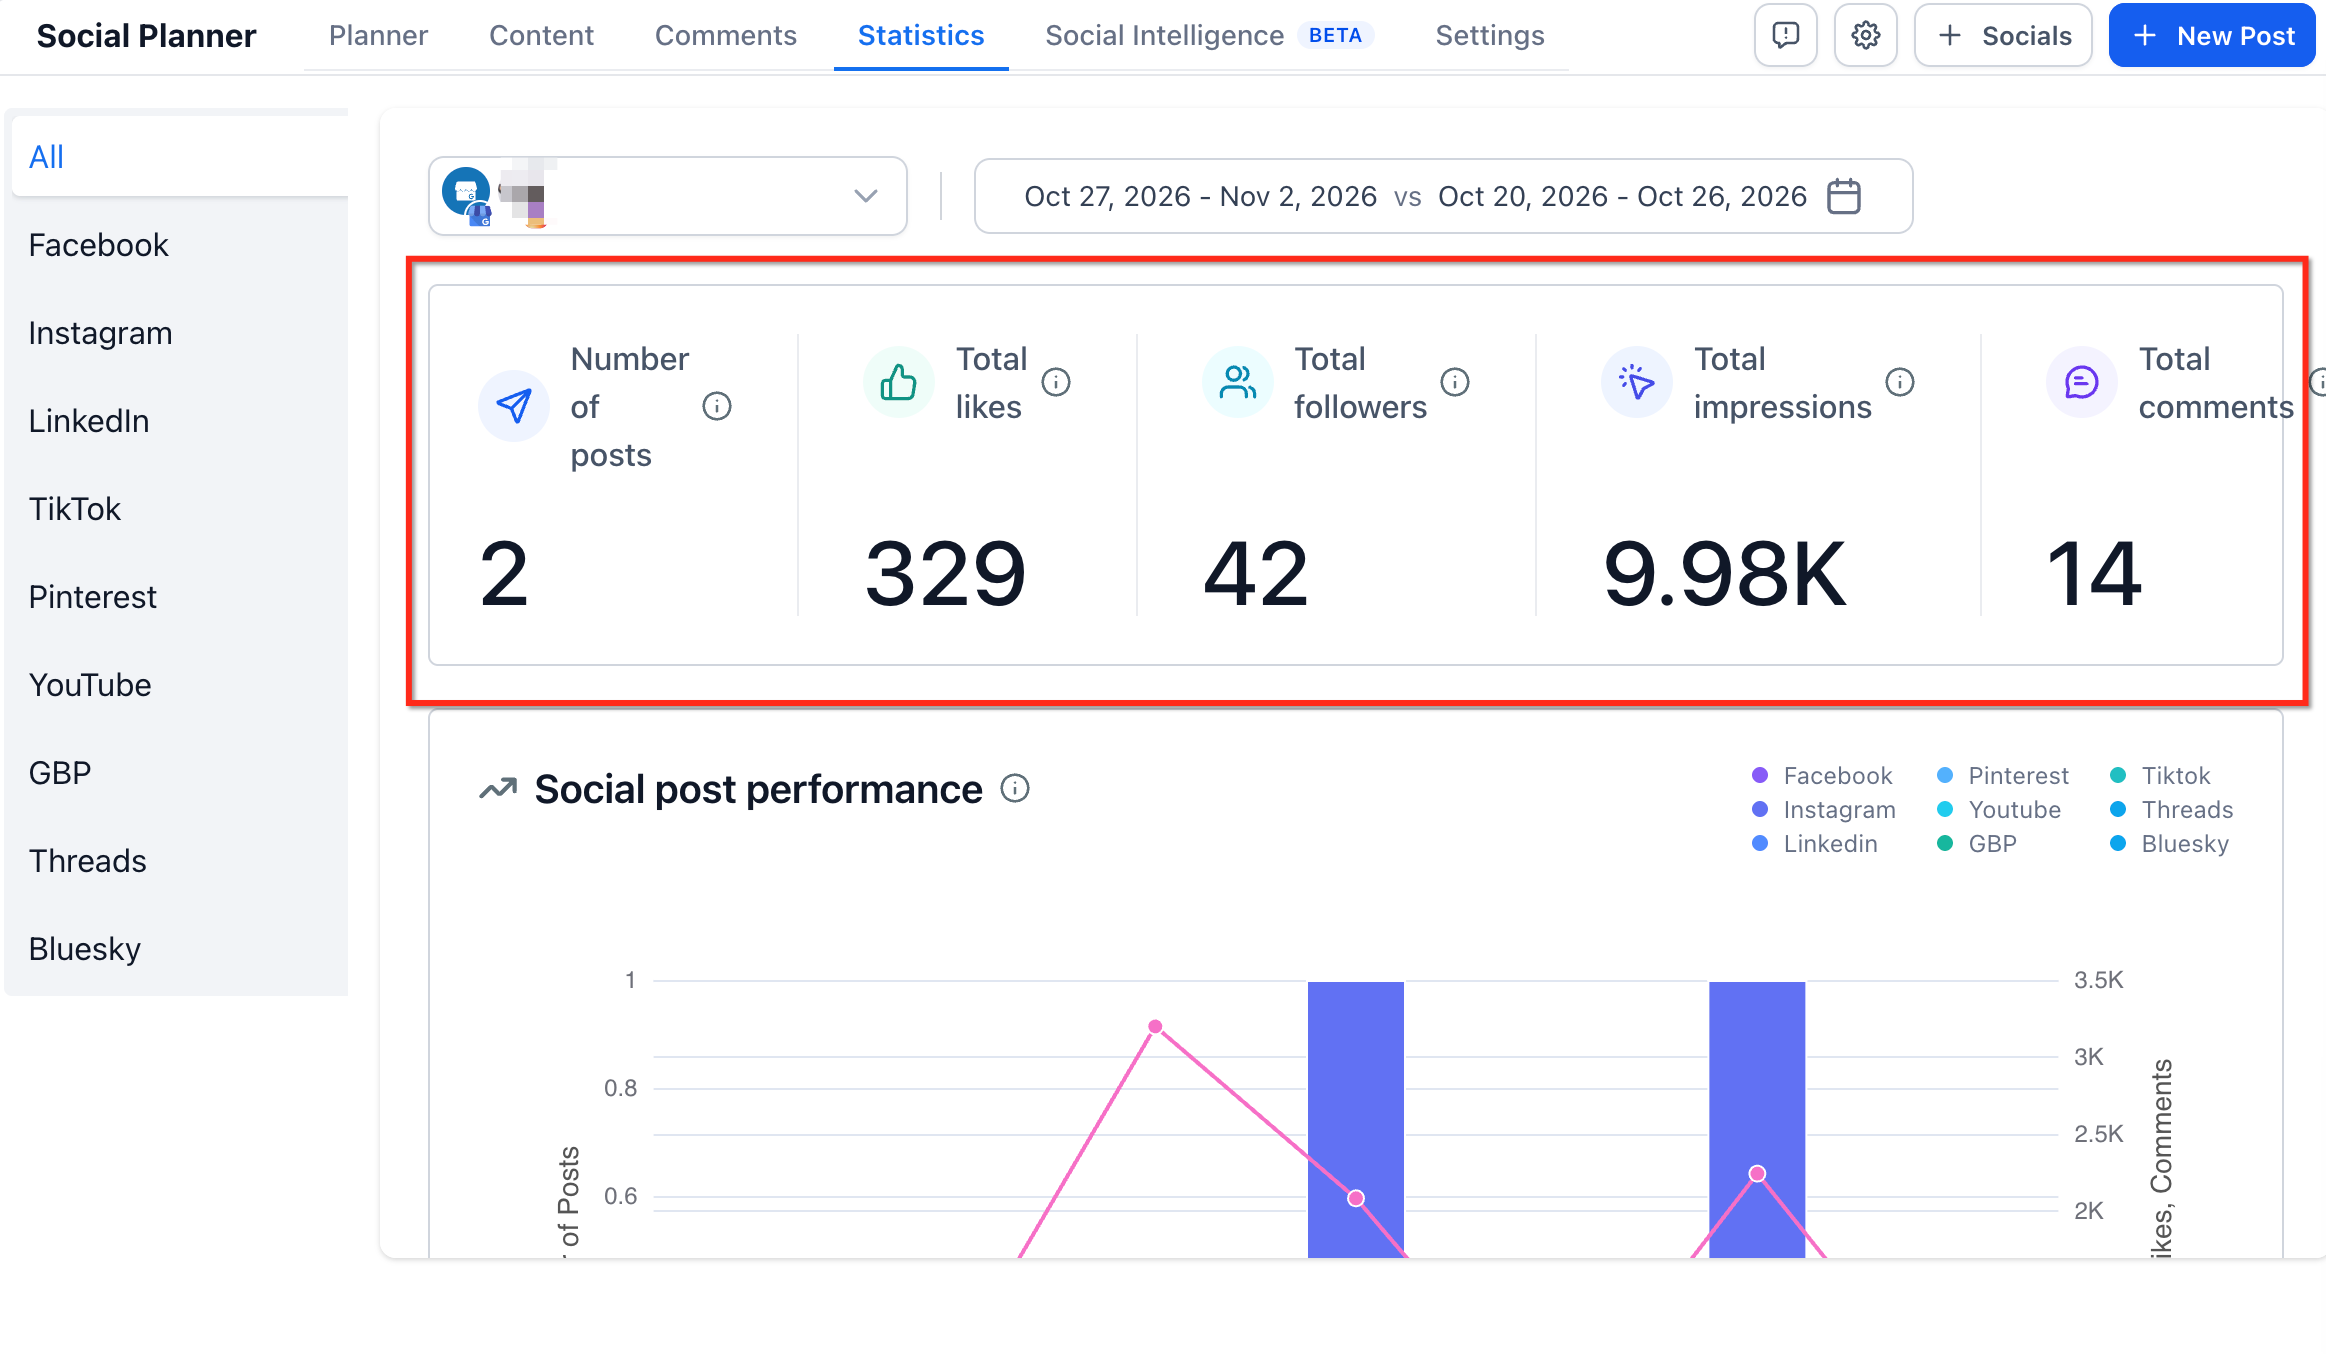
Use this overview to monitor performance at a glance and identify changes in publishing activity and audience engagement.
Social Post Performance
The Social Post Performance report uses an interactive graph to display publishing activity and engagement trends.
It combines bar and line graphs to help you compare post volume with available performance metrics.
Bar Graph – Weekly Posts
Displays the number of posts published each week across the selected social media accounts.
Use this graph to identify posting frequency and changes in publishing activity.
Line Graph – Engagement
Displays available daily performance trends, including impressions, likes, and comments.
Engagement data reflects interactions recorded during the reporting period, regardless of when the associated posts were published.
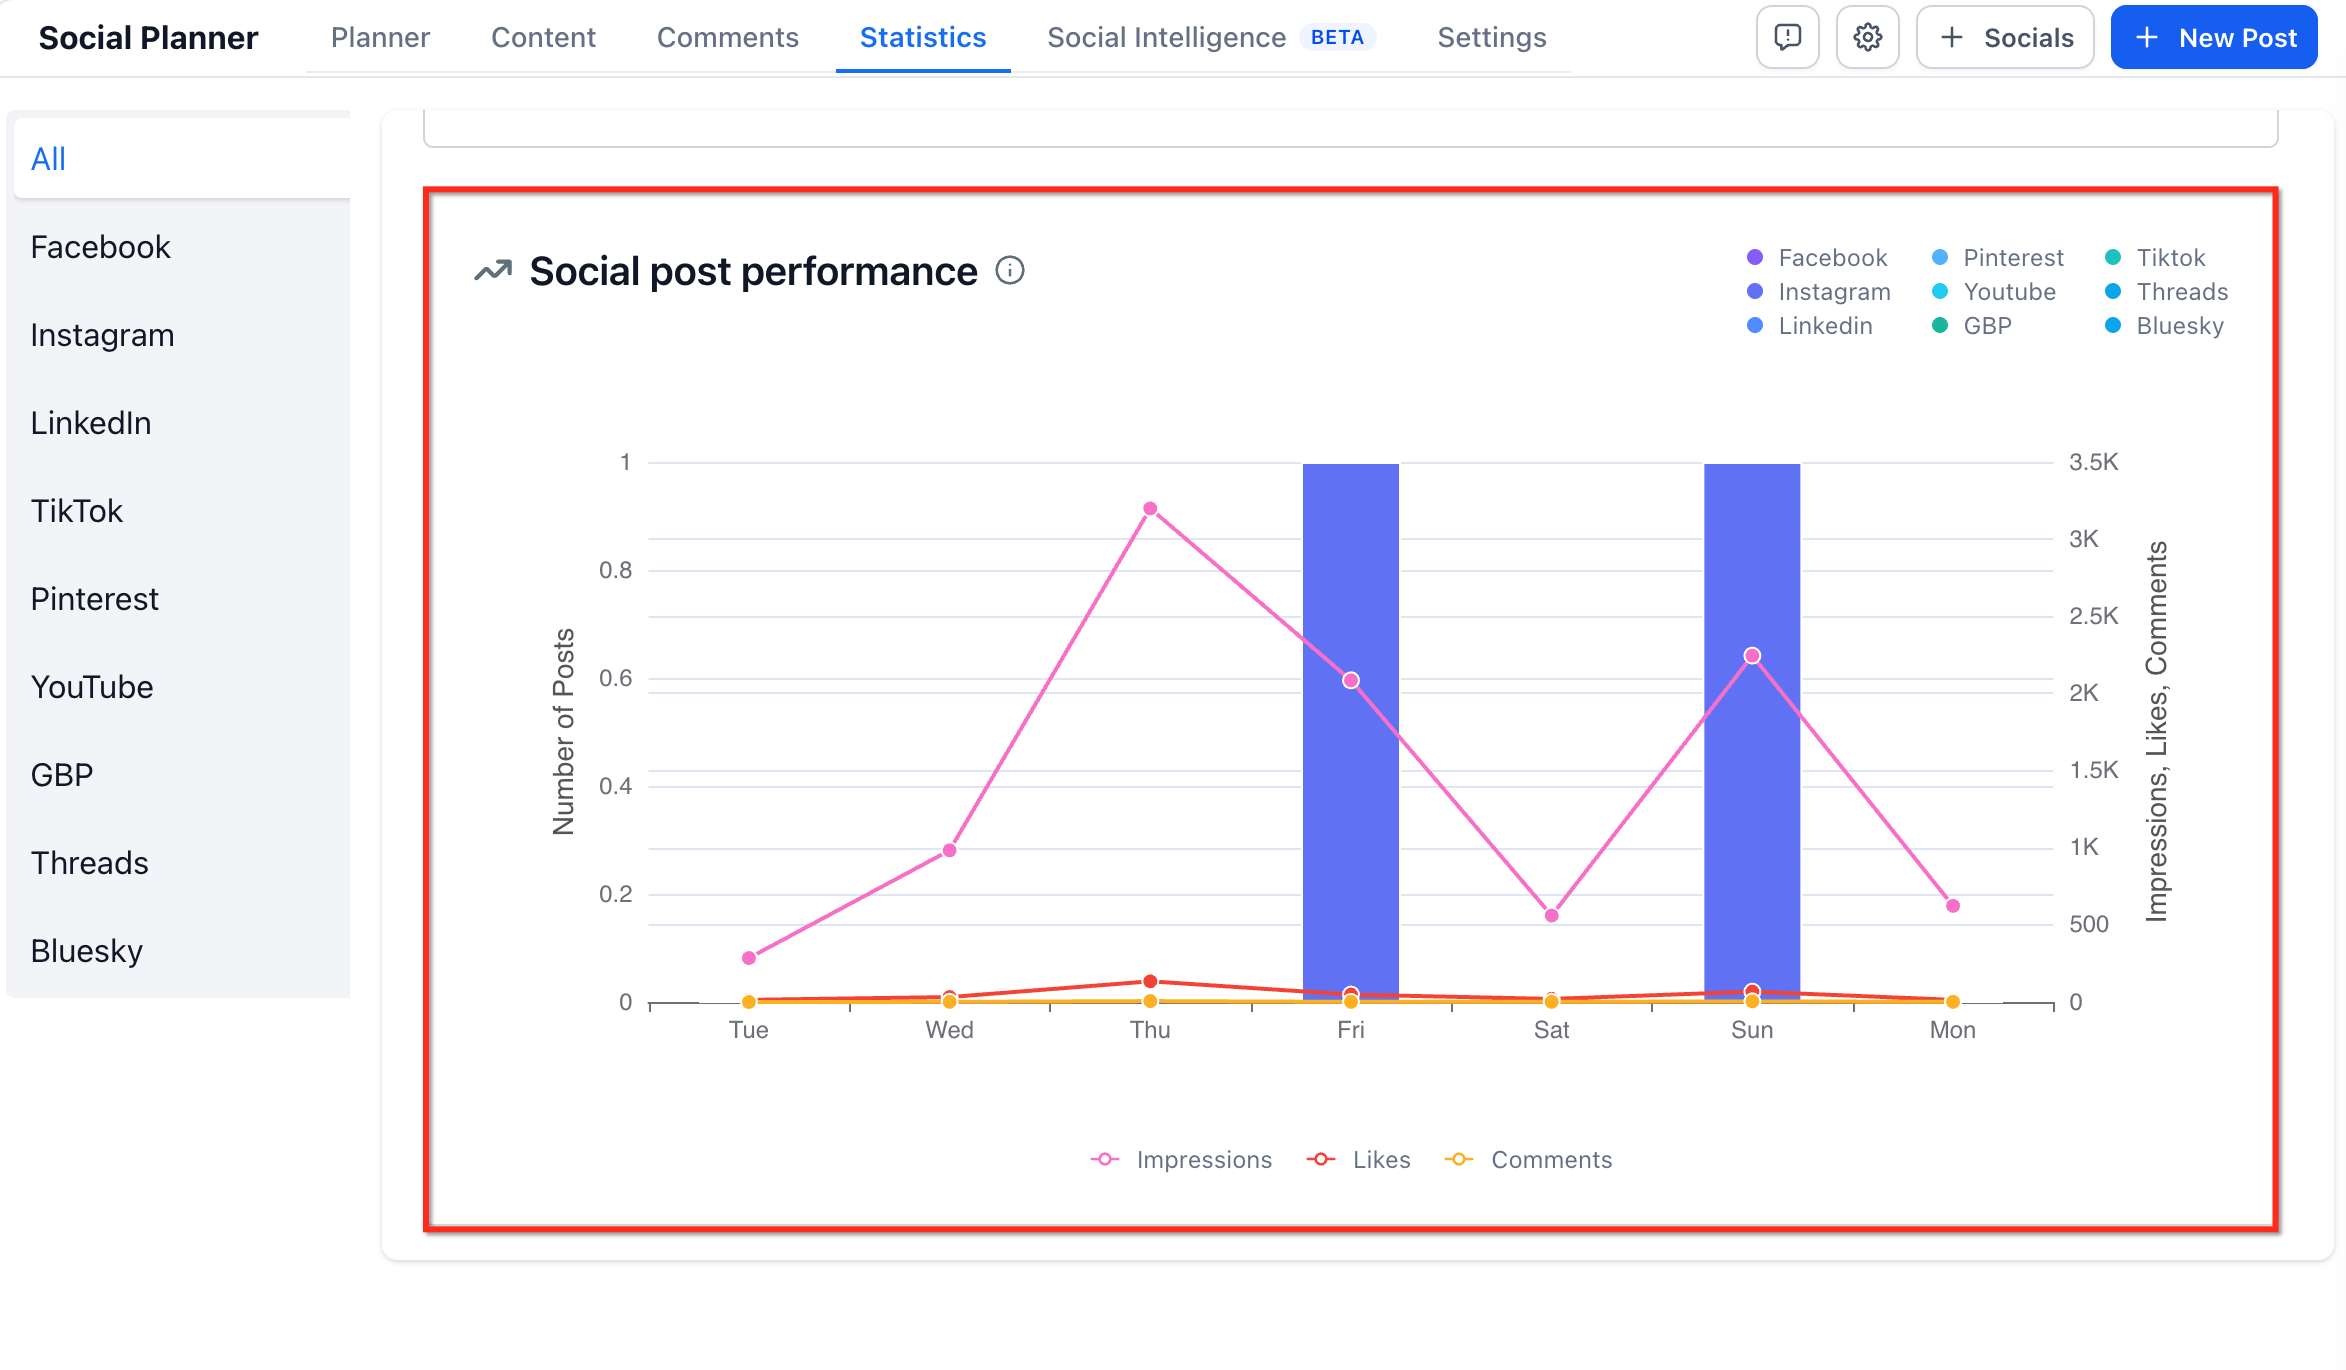
Use these graphs together to understand how posting activity relates to audience interactions.
Link Clicks by Socials
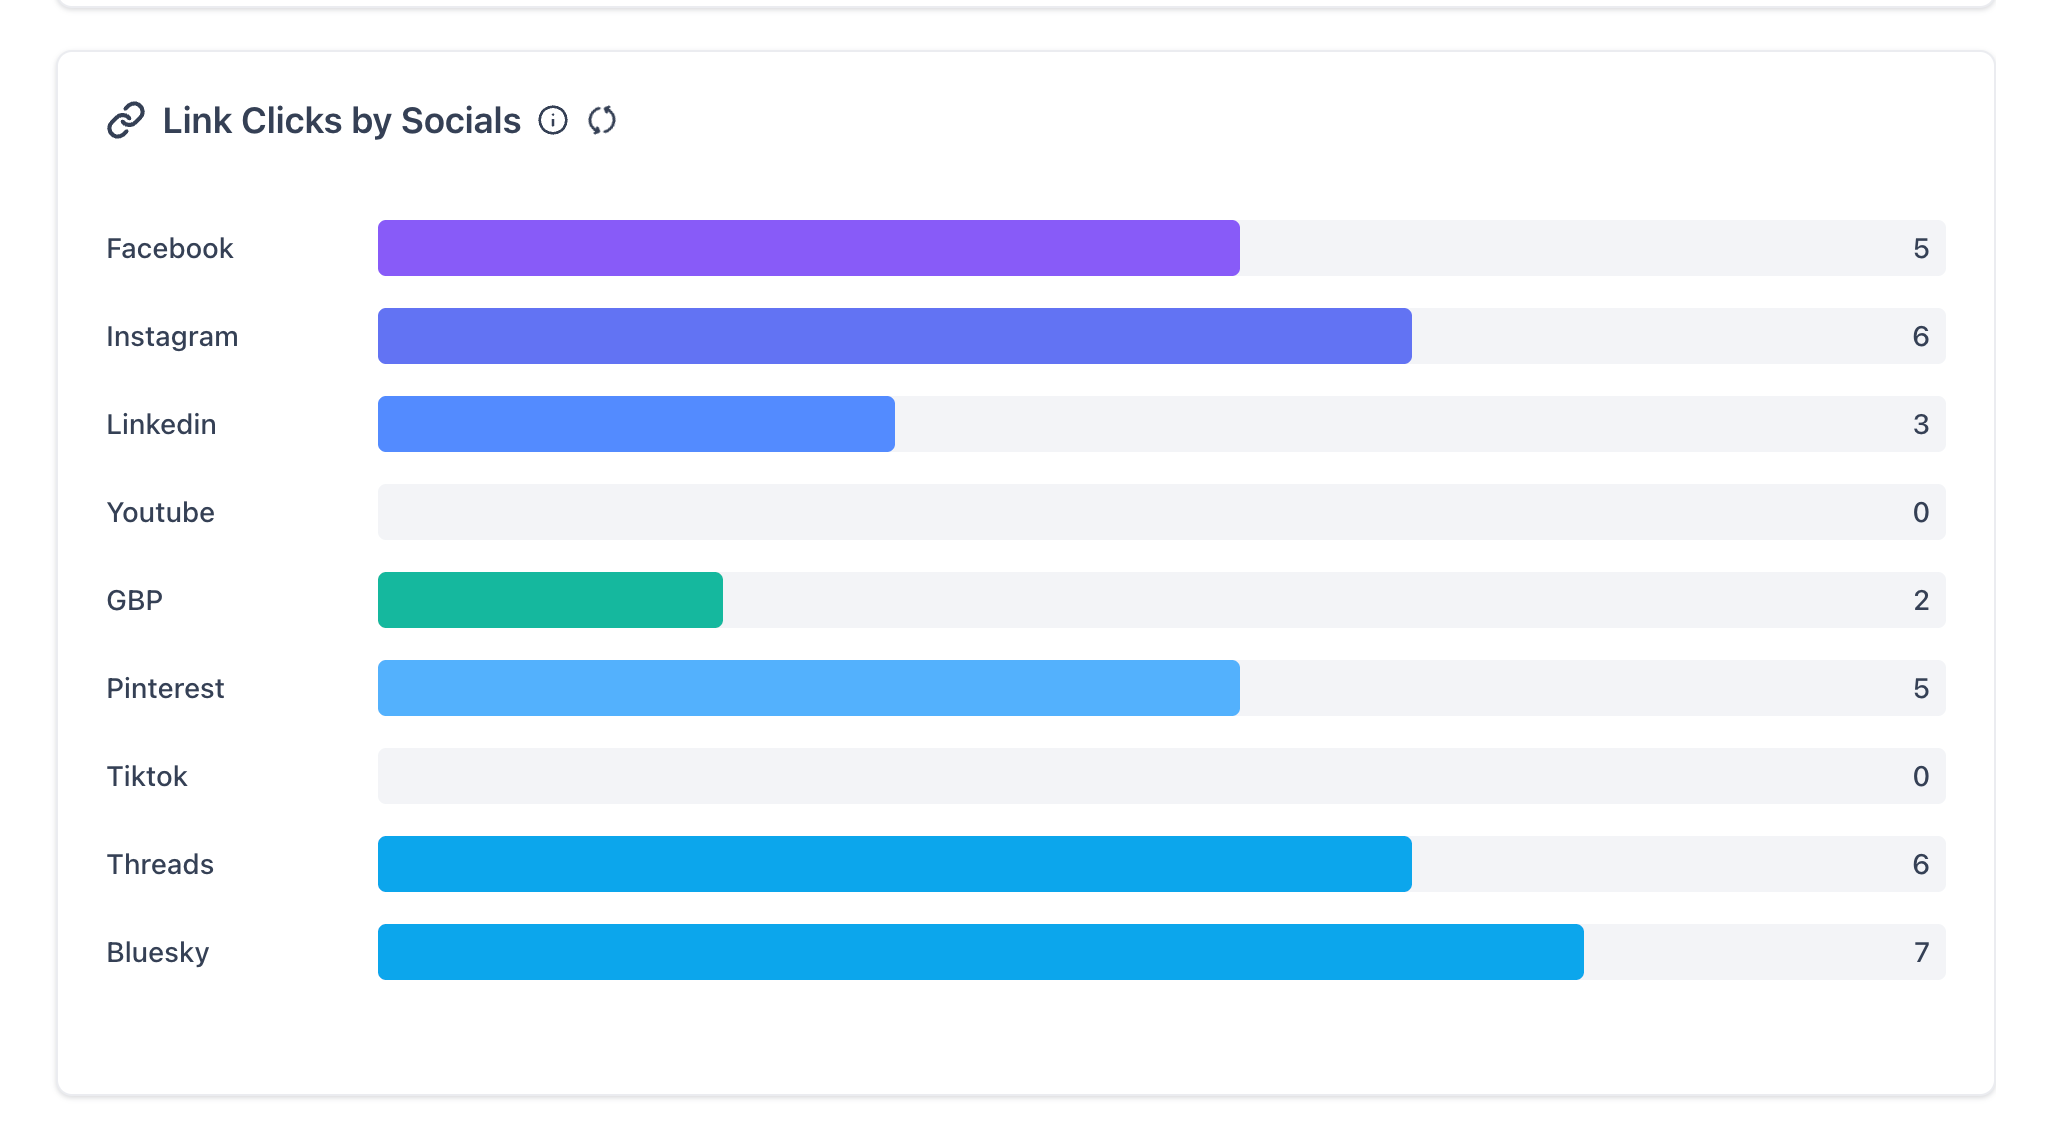
The Link Clicks by Socials report shows the total number of link clicks generated by posts published across selected social accounts.
Clicks are grouped by social platform.
Use this report to identify which social networks generate more clicks on your shared links.
Important: Link click tracking is available only for shortened links created through the Social Planner link shortener.
For additional information, see Social Planner – Link Shortener.
Link Performance
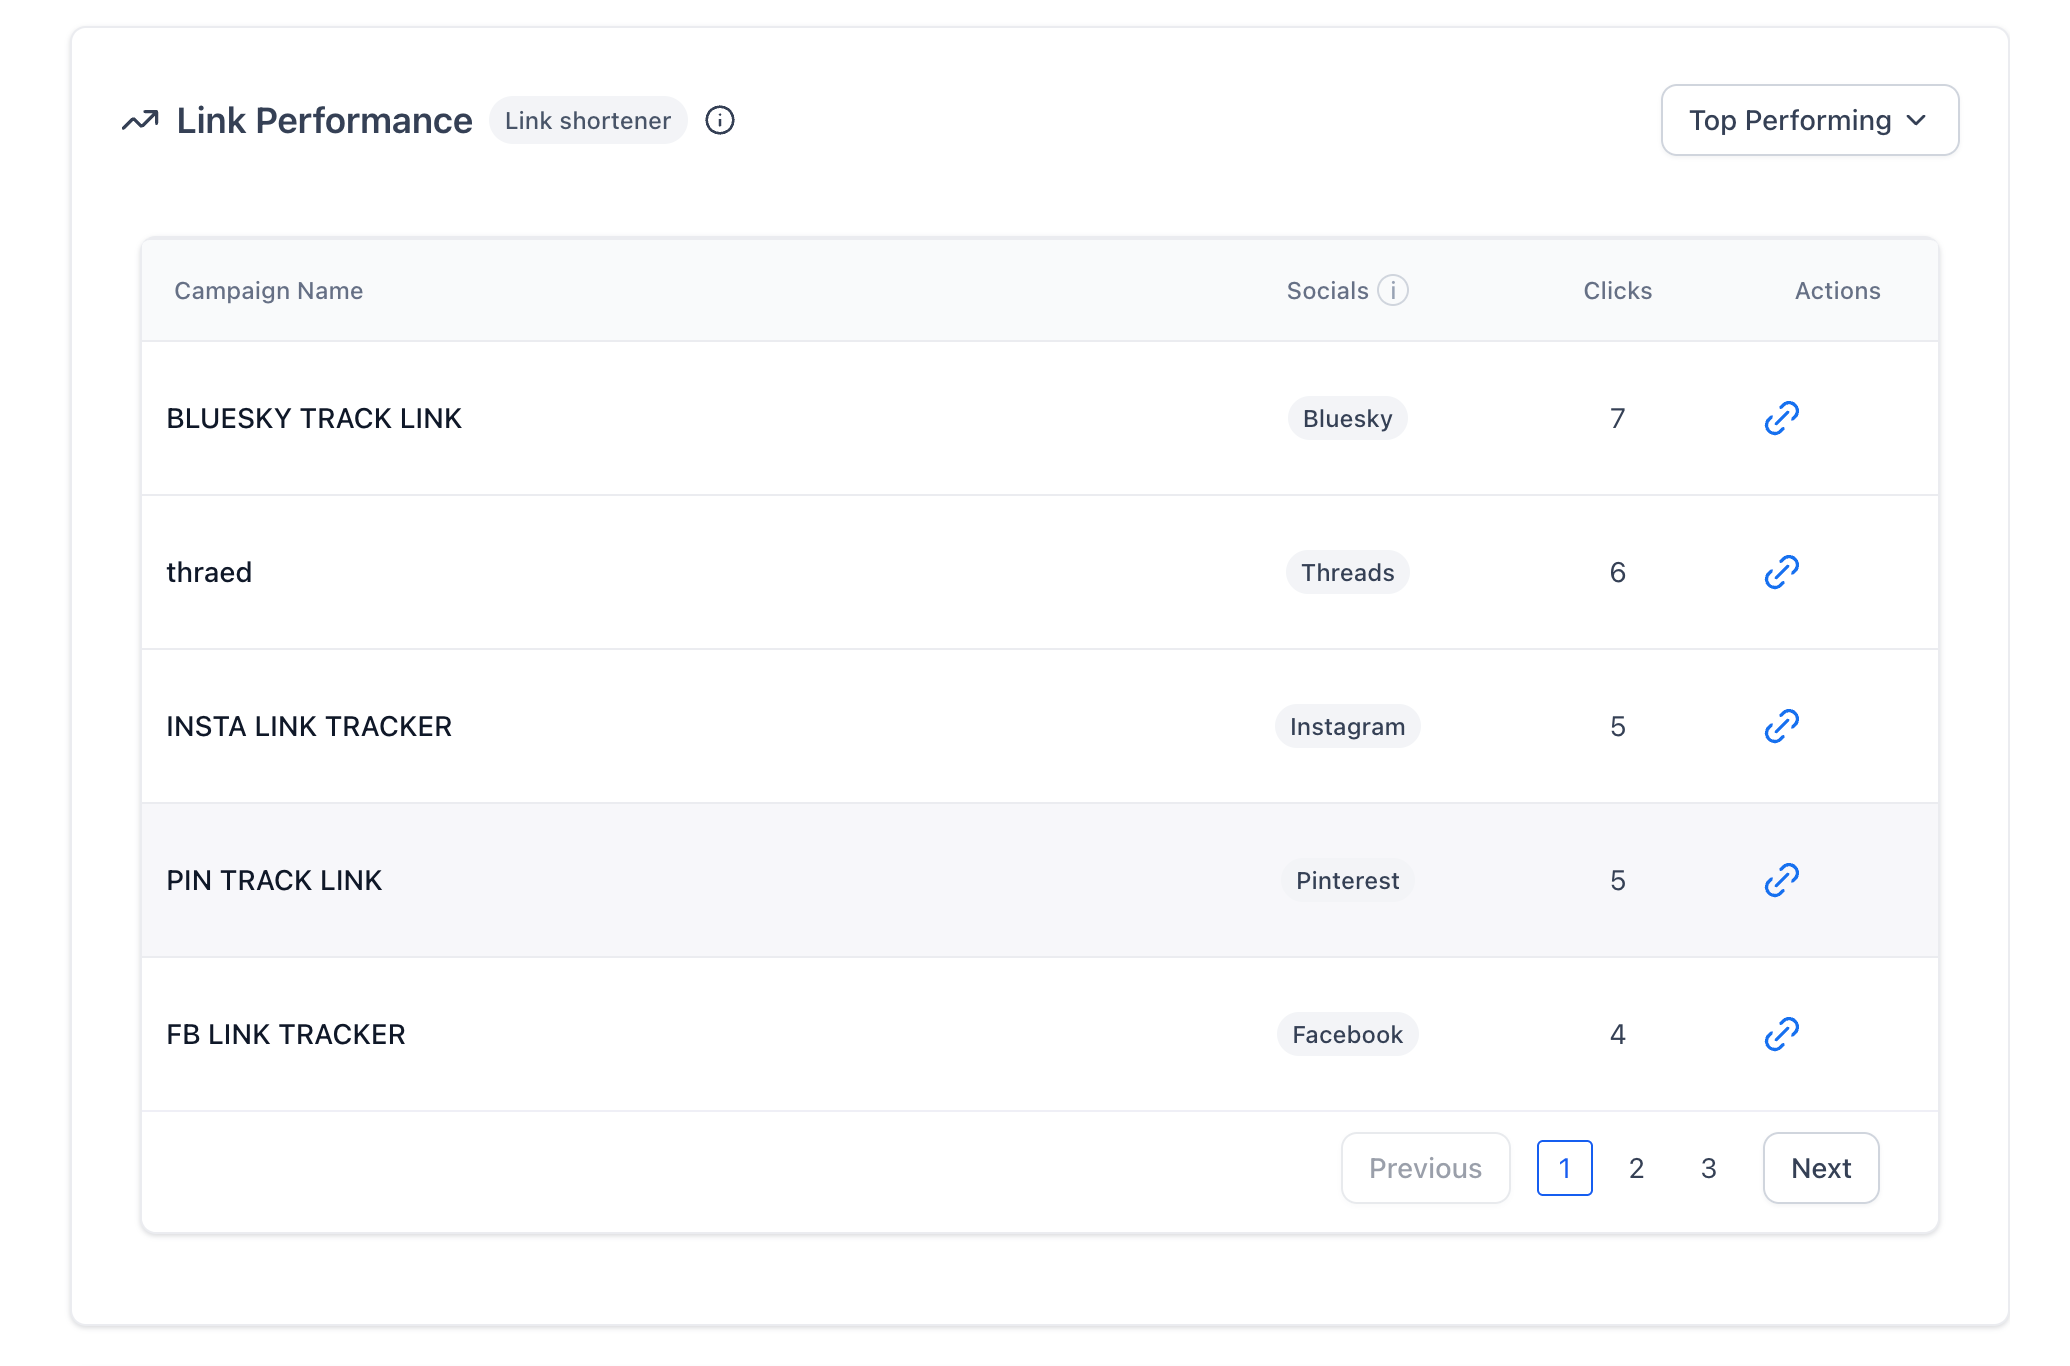
The Link Performance report displays click activity for shortened links shared through Social Planner.
This report helps you:
Track the total number of clicks for individual shortened links.
Compare link performance across social platforms.
Review clicks associated with links belonging to a campaign.
Identify which shared links receive more engagement.
Important: Link performance tracking is available only for shortened links created through the Social Planner link shortener.
Number of Posts
The Number of Posts report shows the total number of published posts by social media platform.
It compares posting activity for the current week with the previous week.
Use this report to:
Review publishing volume by platform.
Identify increases or decreases in posting activity.
Compare posting frequency across connected accounts.
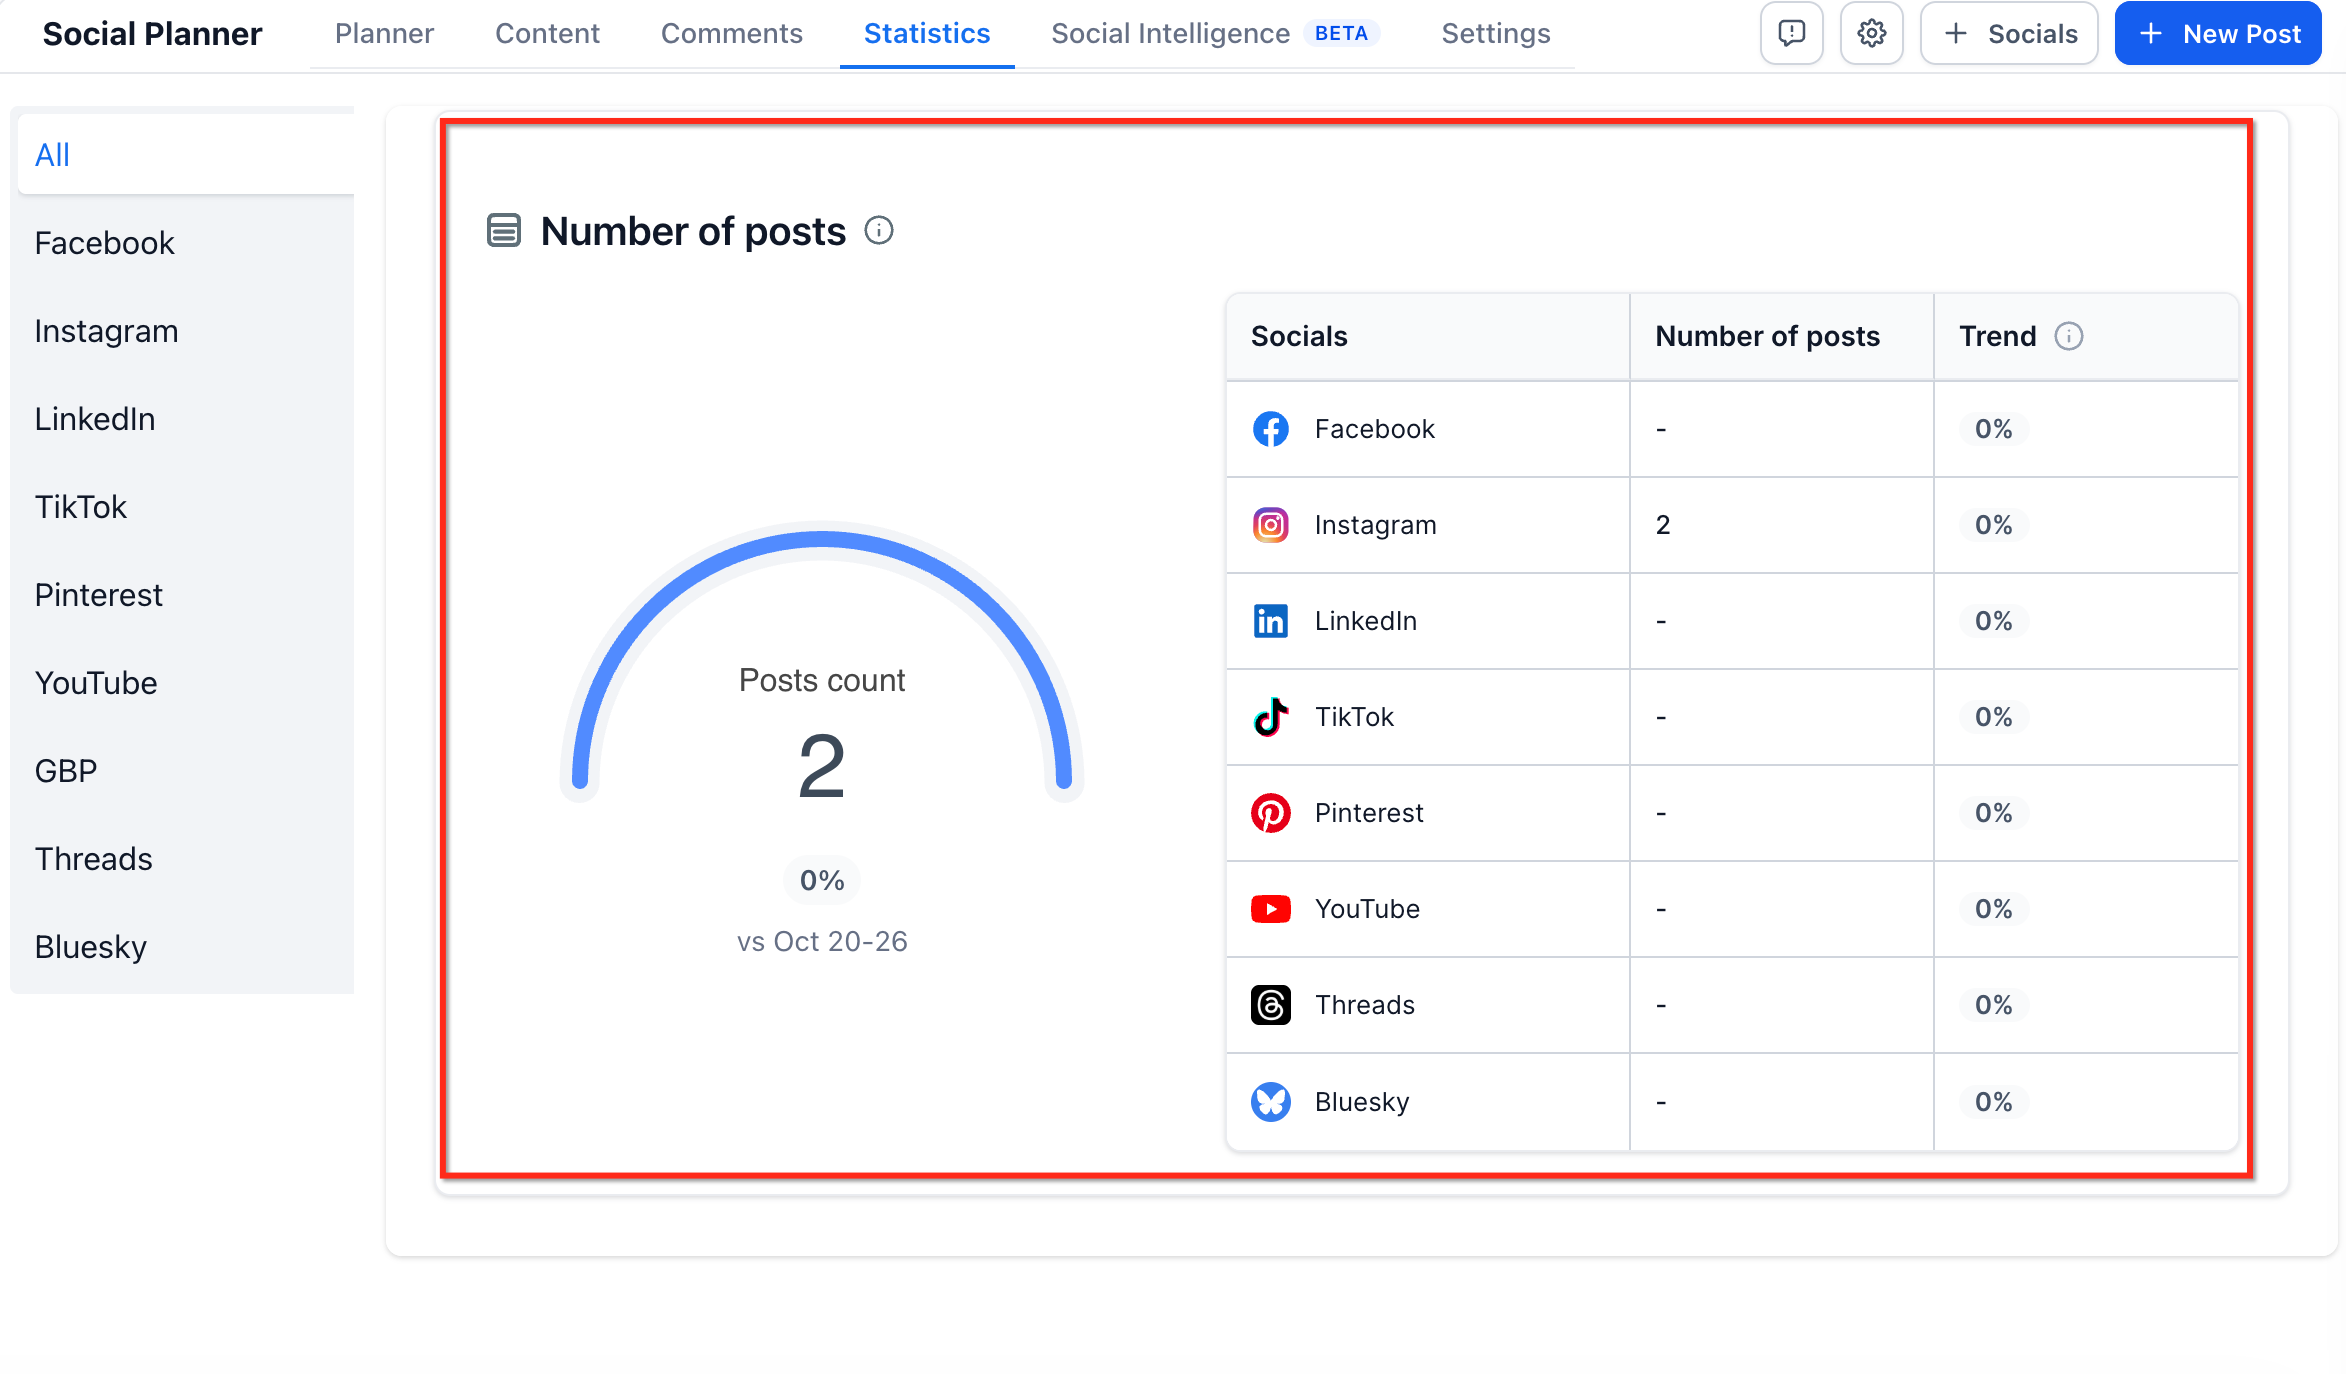
This report helps you understand how consistently content is being published.
Engagement
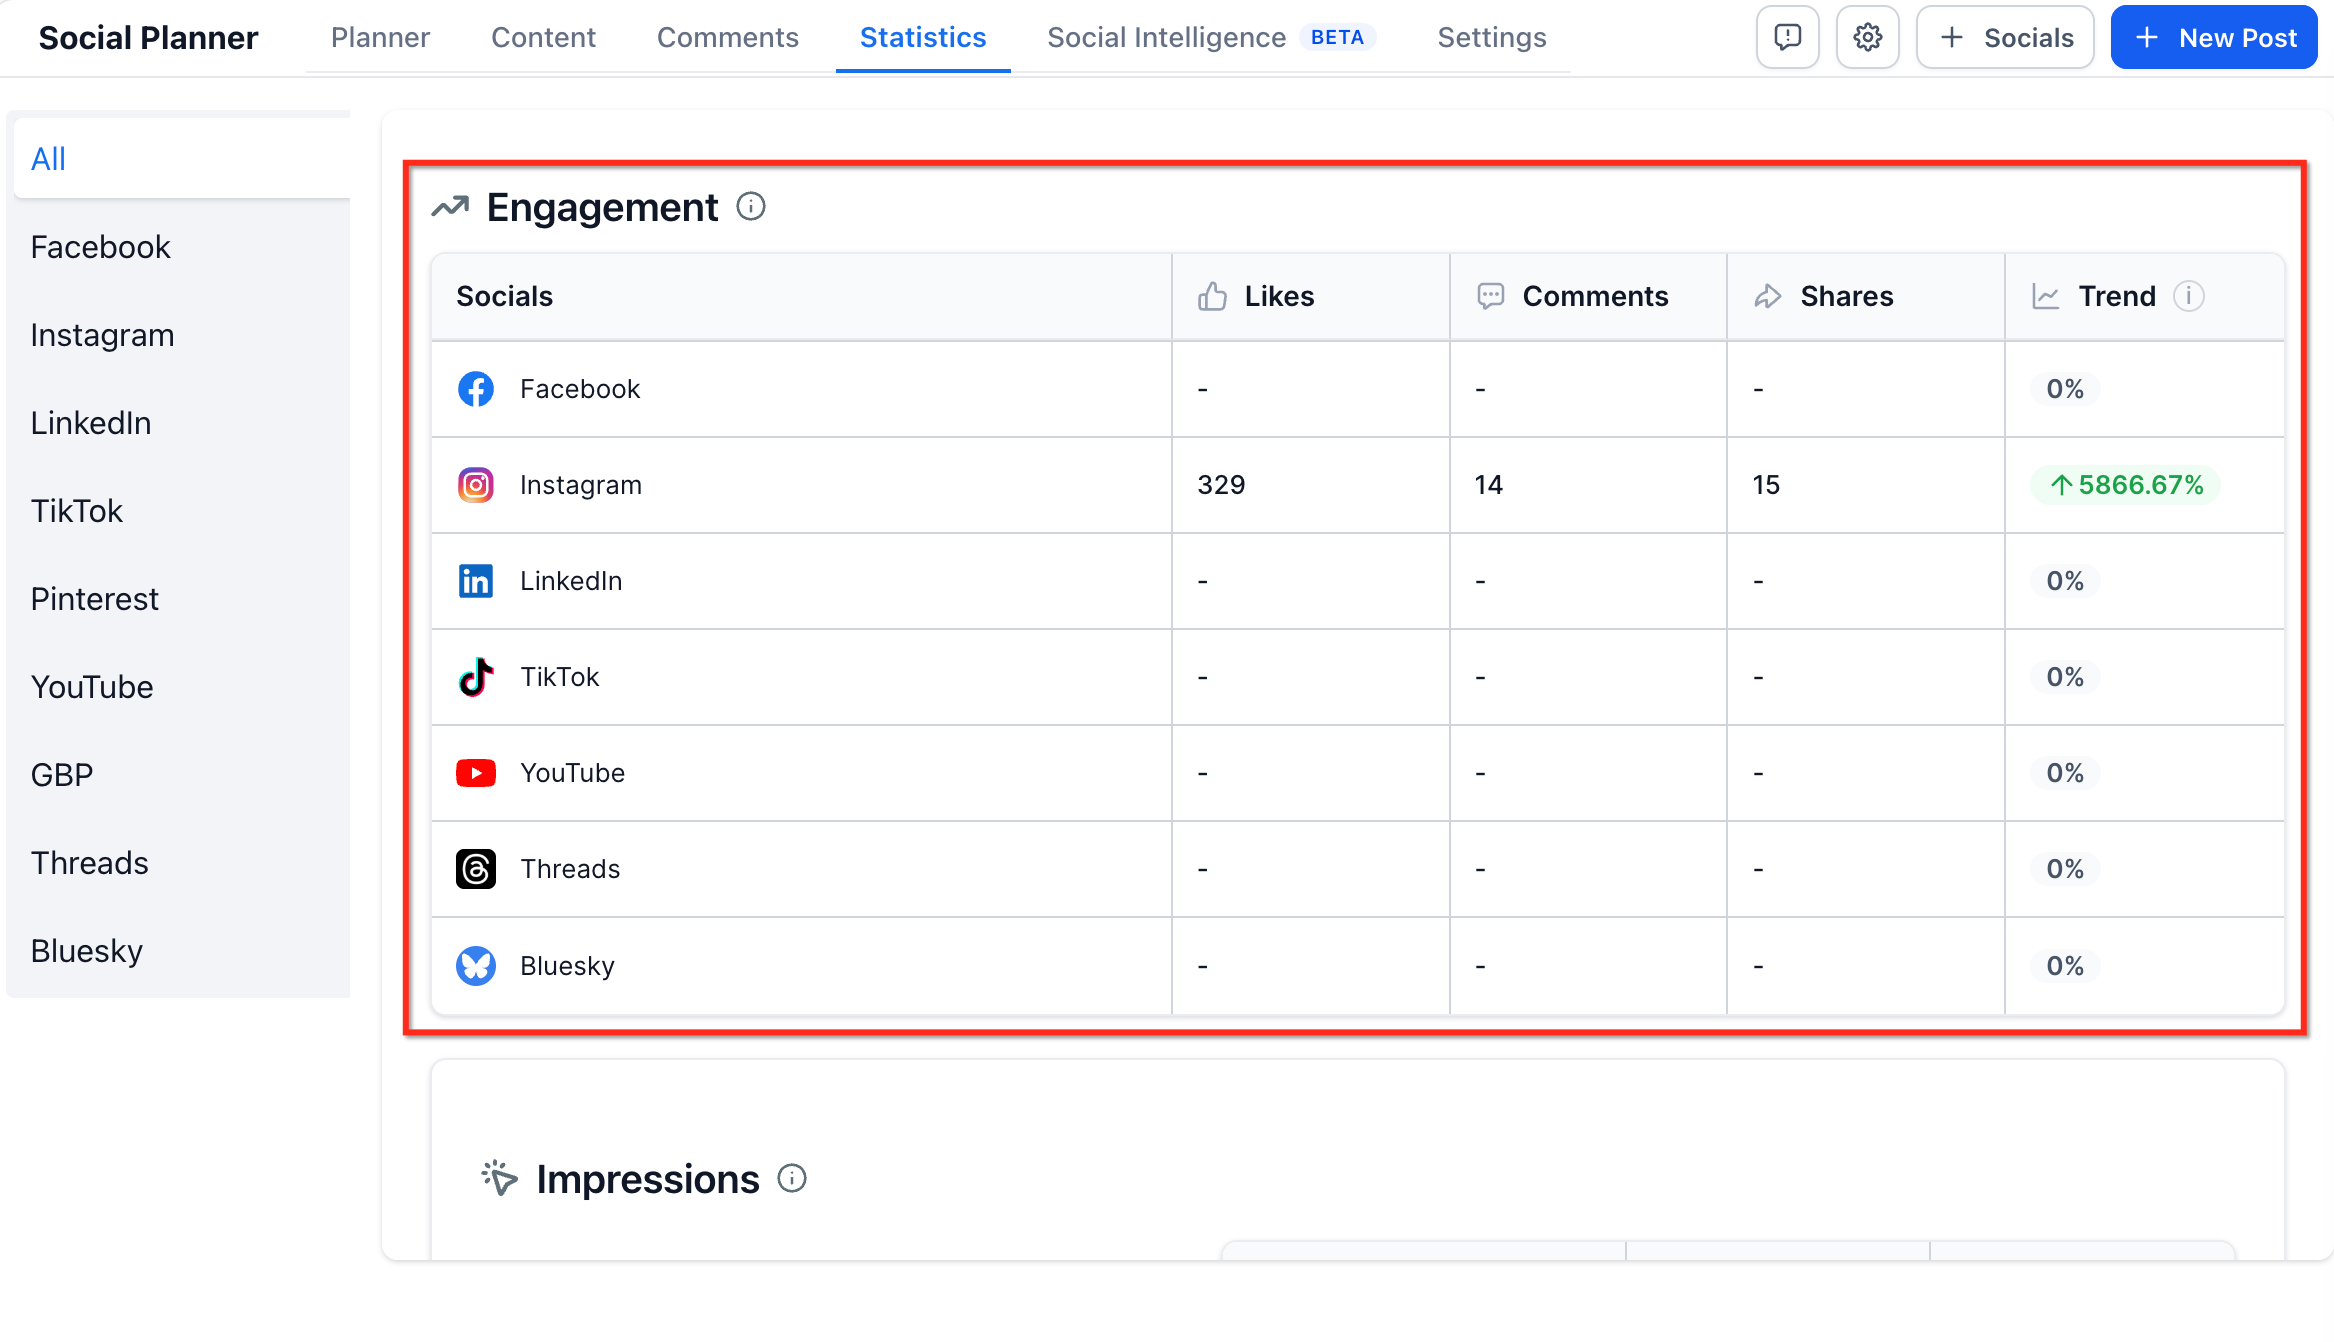
The Engagement report displays likes, comments, and shares received by published posts, broken down by social platform.
It also displays the percentage change in engagement between the current week and the previous week.
Use this report to:
Compare engagement across platforms.
Identify platforms with stronger audience interactions.
Monitor weekly changes in engagement.
Evaluate which types of content attract more interactions.
Note: Available engagement metrics depend on the social platform.
Impressions
The Impressions report shows the number of times published content was displayed on users' screens.
A single person may generate multiple impressions by viewing the same content more than once.
The report also displays the percentage change in impressions between the current week and the previous week.
Use this report to understand content visibility and monitor changes in how frequently posts are displayed.
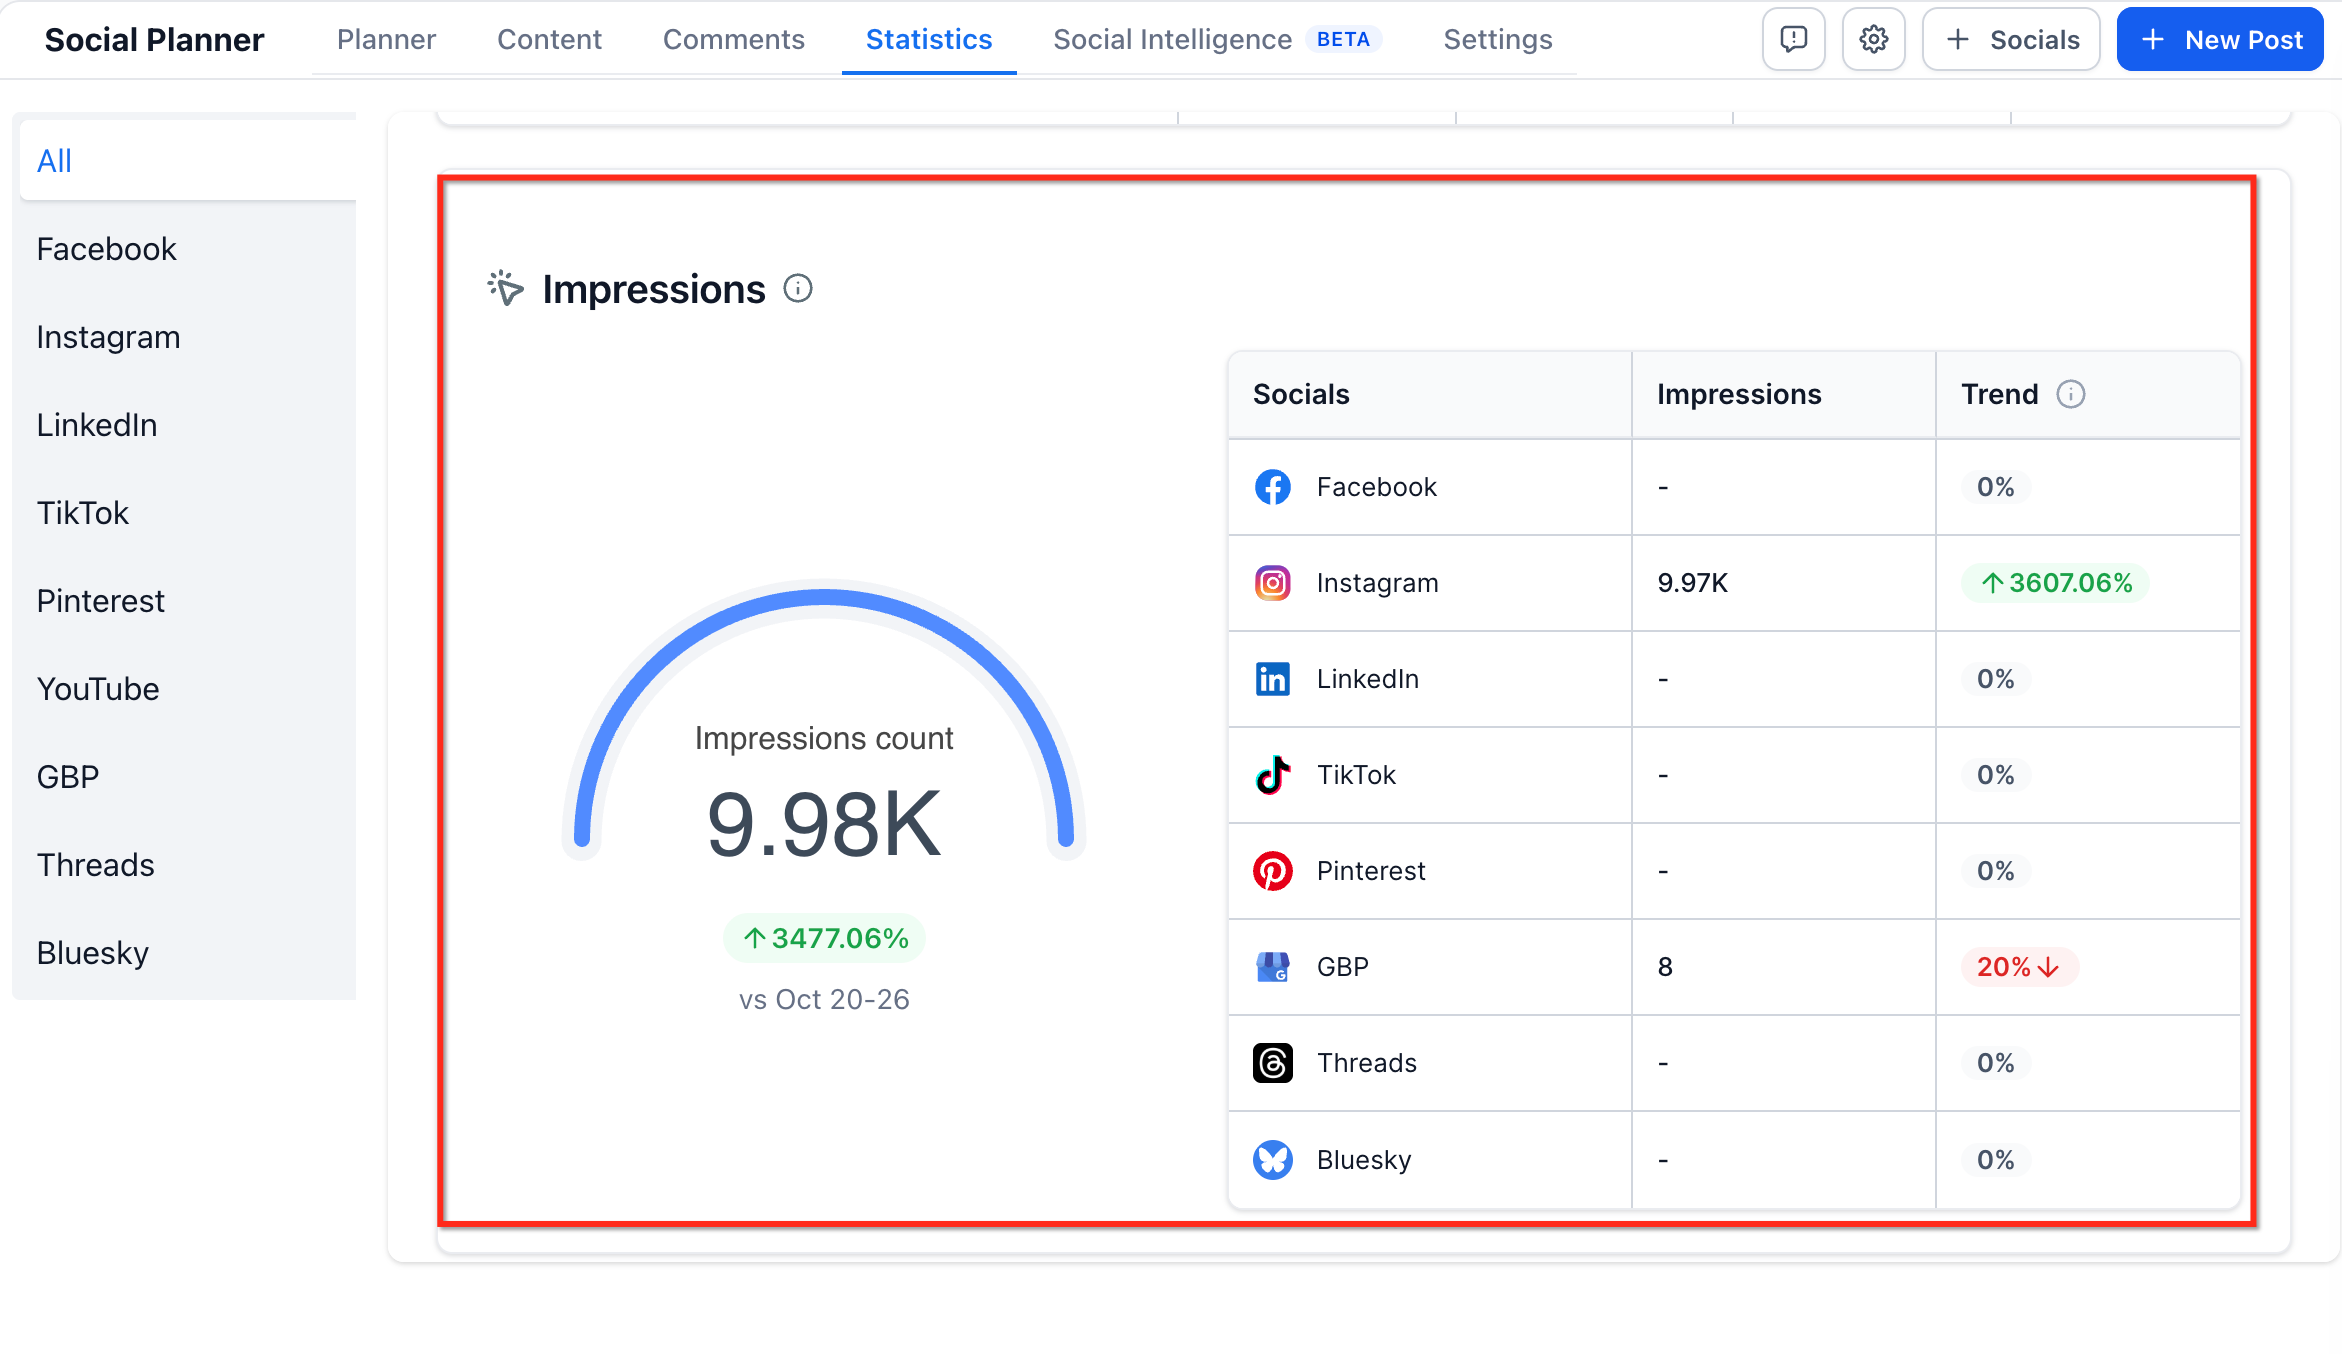
Note: Impressions are available only for supported platforms.
Post Reach
The Post Reach report helps you understand how many people have seen content associated with your social account or page.
Depending on the platform, this may include visibility generated by:
Published posts
Check-ins
Advertisements
Social information associated with interactions on your page
Other supported page content
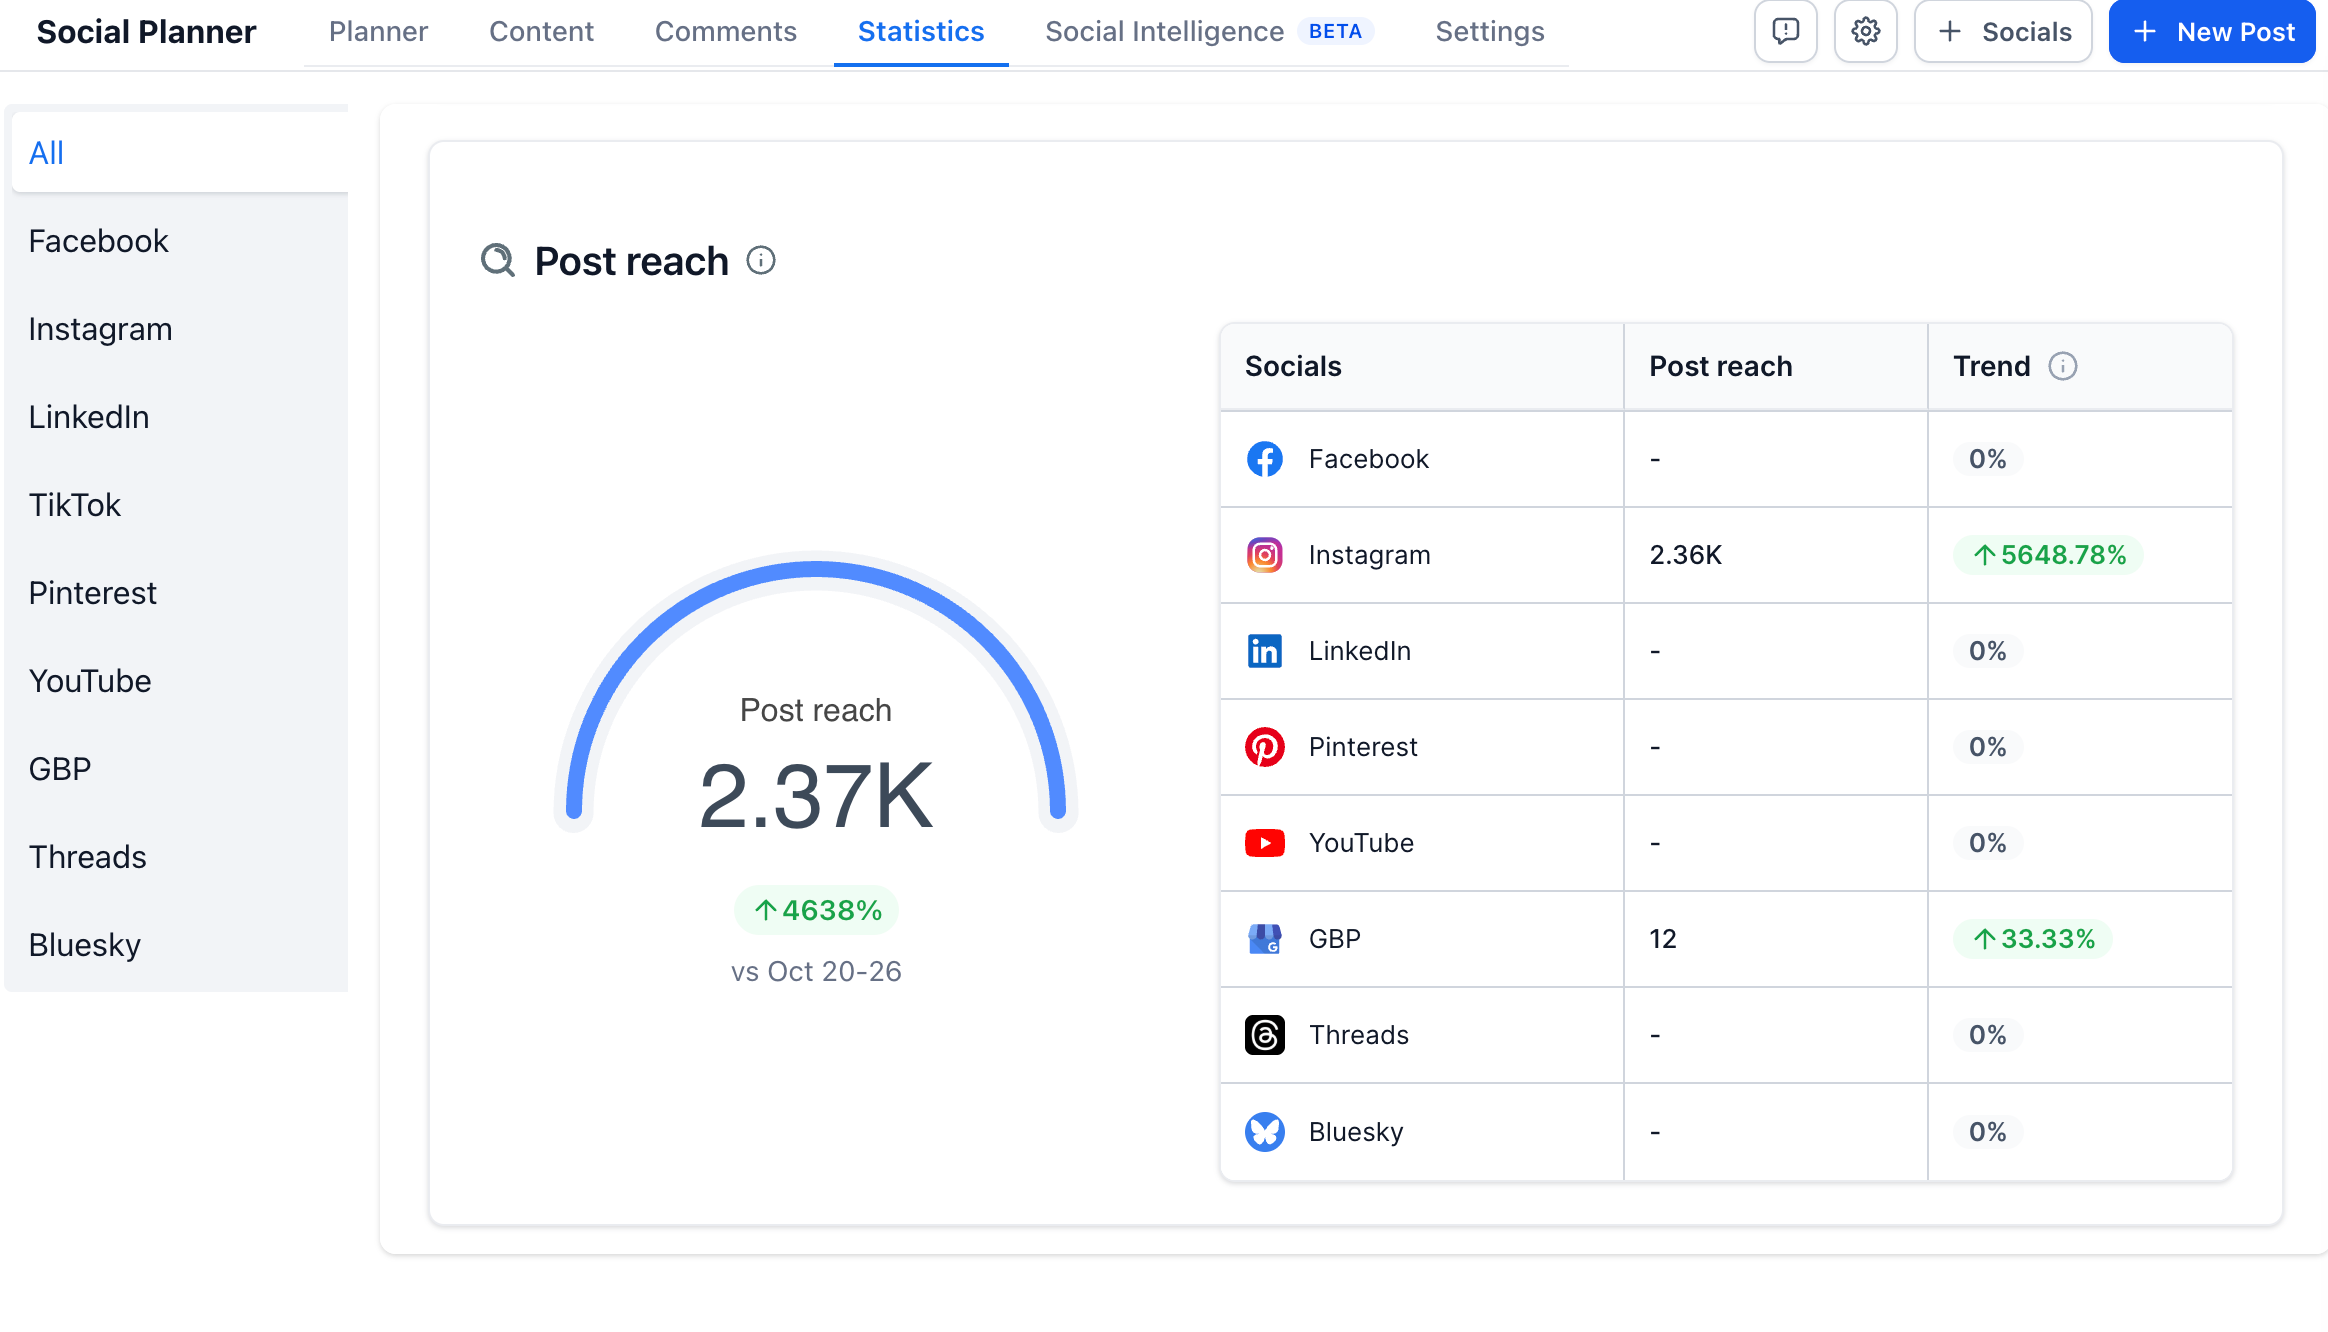
The report compares post reach for the current week with the previous week and displays the percentage change.
Google Business Profile Reporting
For Google Business Profile, the reported metric reflects supported customer actions, including:
Call Clicks
Website Clicks
Food Orders
Bookings
Food Menu Clicks
Direction Requests
Important: Google Business Profile metrics reflect these customer interactions rather than the same reach definition used by other social platforms.
Top Performing Posts
The Top Performing Posts report displays your highest-performing published social posts.
Posts are ranked based on the number of likes they receive.
Use this report to:
Identify posts that generate the most likes.
Review your top-performing content across available reporting history.
Understand which content resonates with your audience.
Use successful posts to inform future content planning.
To view an individual post:
Open the Top Performing Posts report.
Find the post you want to review.
Click the Eye icon beside the post.
View the post on its original social media platform.
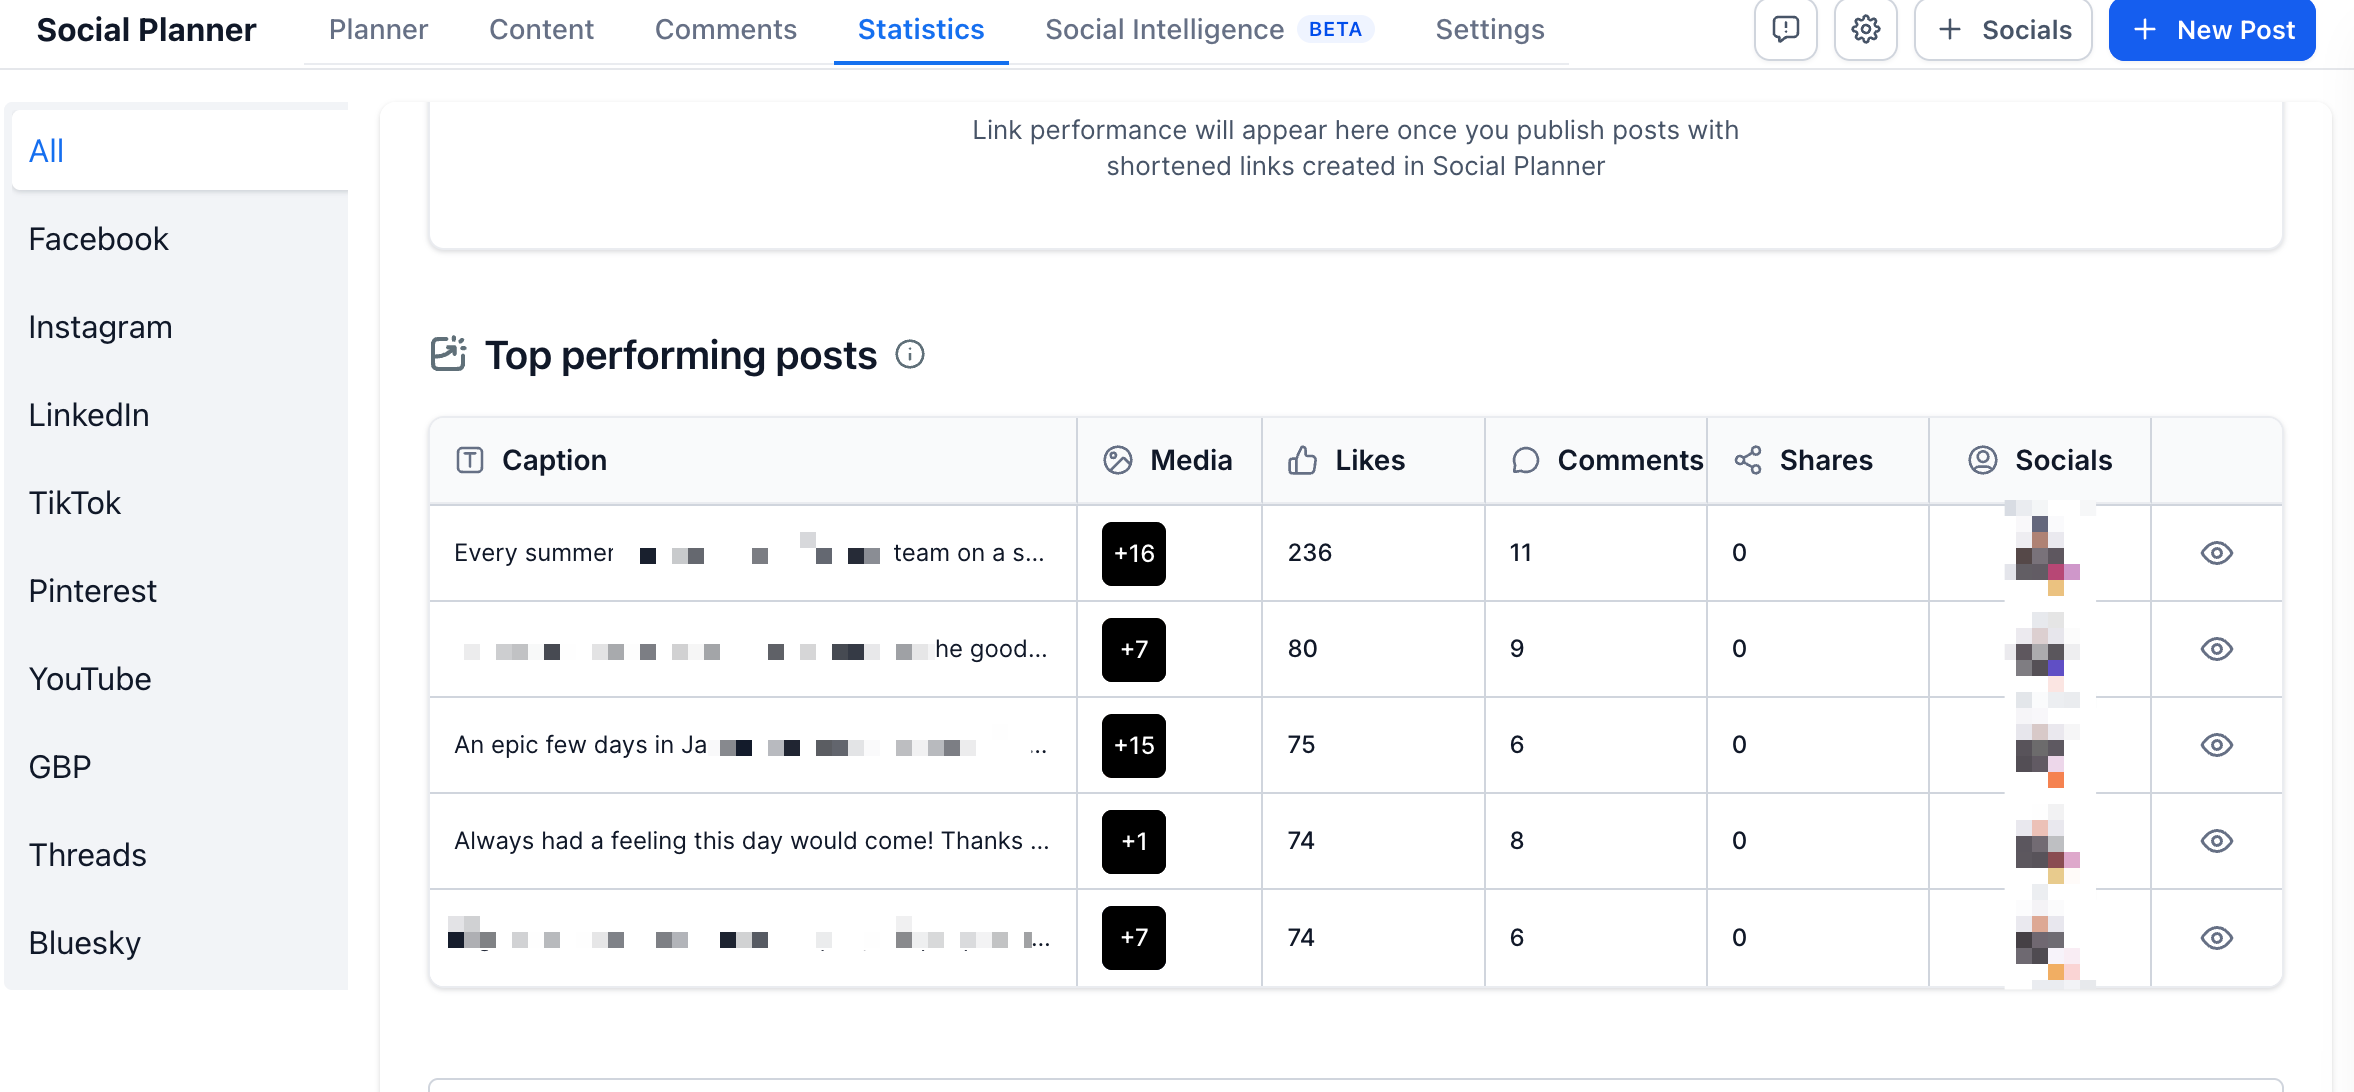
Note: Top-performing post reporting is available only for supported platforms.
Engagement Stats
The Engagement Stats report provides a detailed breakdown of available engagement metrics by social platform.
It helps you understand how audiences interact with content across your connected accounts.
Use the selector at the top of the report to switch between:
Total Engagement: Review available interactions, including likes, comments, and shares.
Total Followers: Compare follower totals across supported social accounts.
Total Likes: Compare likes received across supported platforms.
Use this report to identify platforms with higher engagement and adjust your content strategy based on performance.
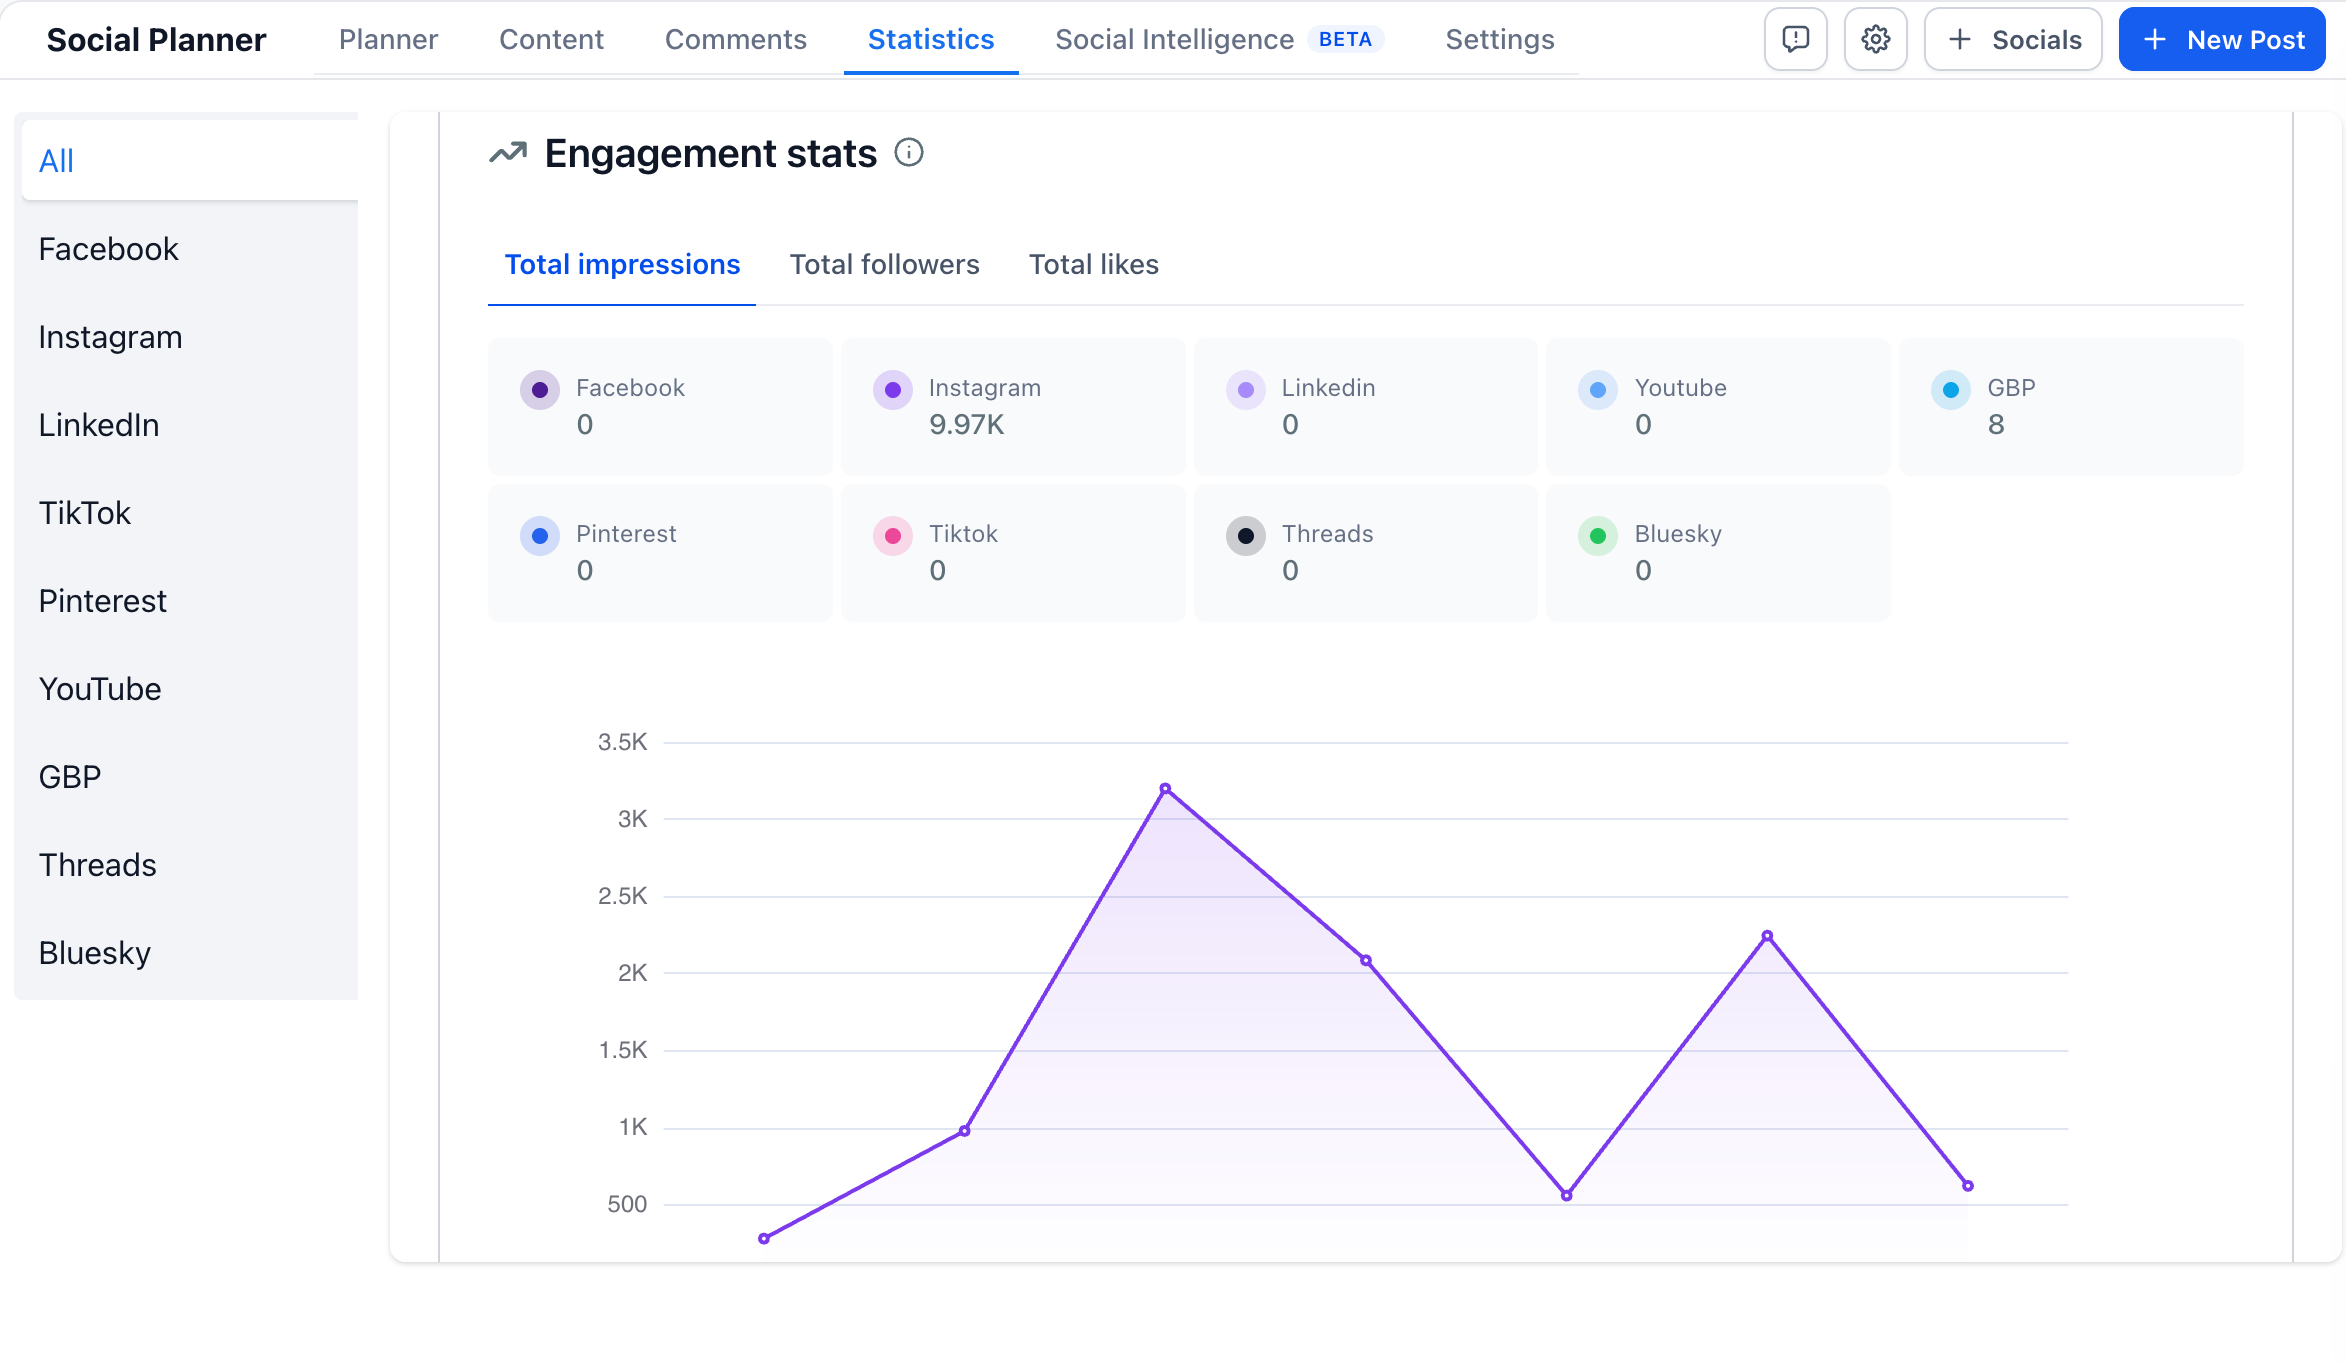
Note: Some platforms do not provide all engagement or follower metrics.
Gender Demography
The Gender Demography report provides available audience demographic information.
Depending on supported platform data, the report may include:
Male
Female
Unknown
Age ranges
Demographic data is based on information users have shared with the respective social media platforms.
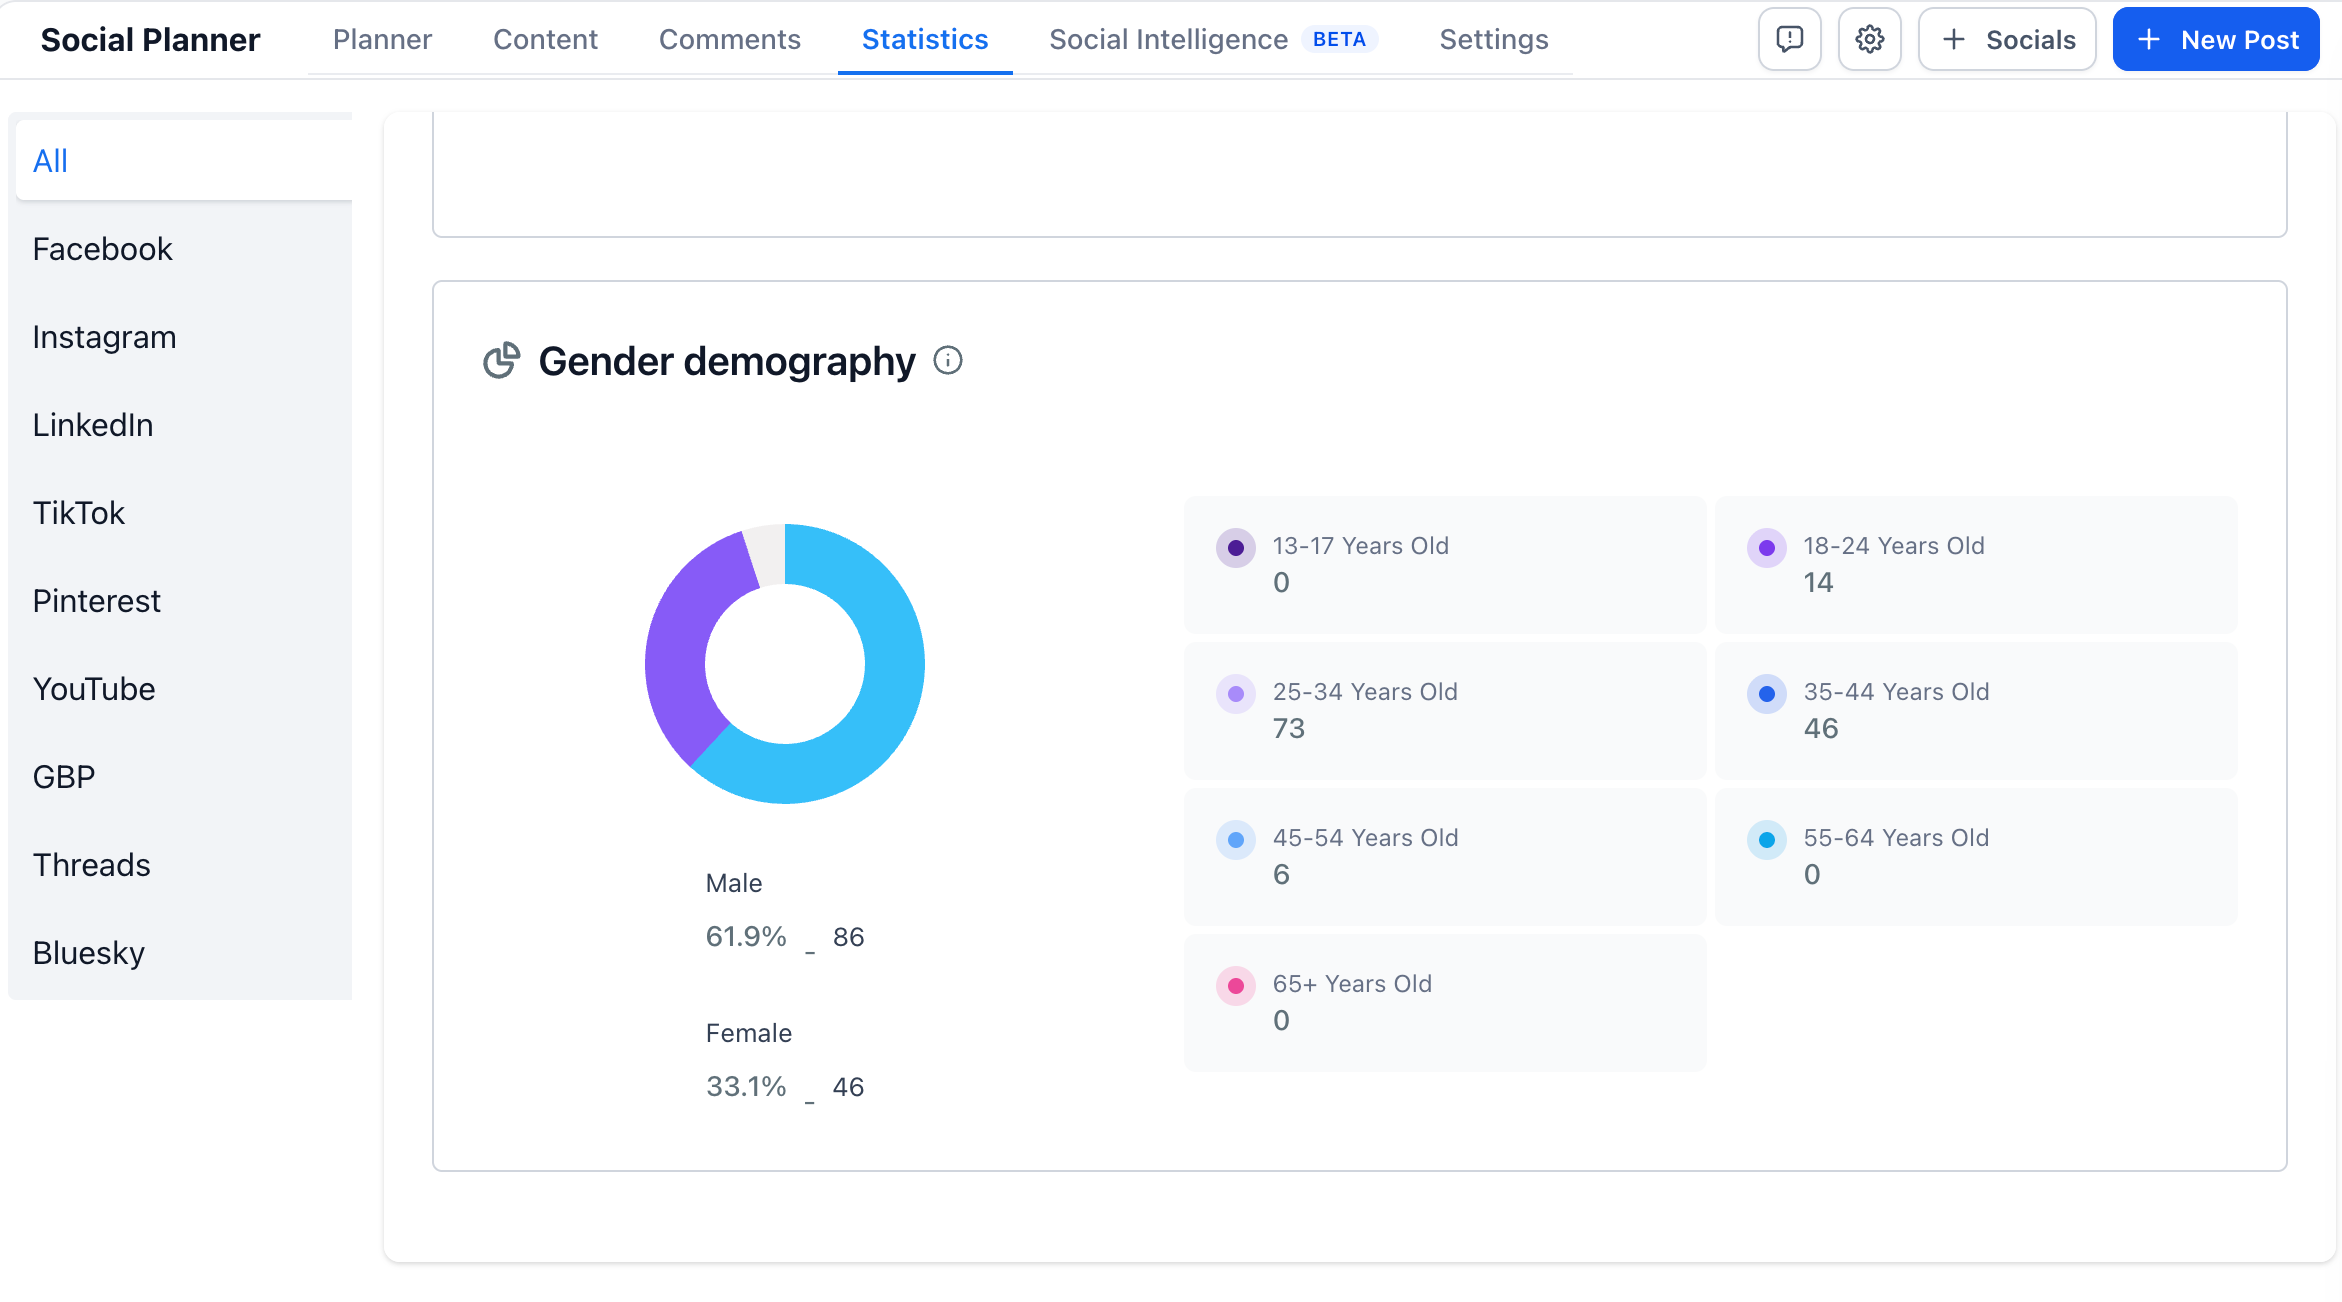
Use this report to understand the available demographic composition of your audience and refine content for relevant audience groups.
Important: Instagram demographic reporting requires at least 100 followers.
Demographic information may be unavailable for other platforms because of API limitations.
Important Considerations
Understanding reporting limitations helps you interpret analytics accurately.
Metric Availability: Not all metrics are available on every platform. Reporting depends on the data provided by each platform's API.
Reporting Delays: Analytics may take one or more days to update, depending on the platform and metric.
Account Requirements: LinkedIn dashboard analytics require Pages, while TikTok dashboard analytics require Business accounts. Post-specific statistics may have different account requirements.
Instagram Demographics: Demographic insights require at least 100 followers.
Account Authorization: Connected accounts may require updated permissions or reconnection to continue displaying analytics.
Post Sync: Engagement insights for supported synchronized posts refresh approximately every 24 hours.
Platform Differences: Metrics may use different definitions across social platforms. Review platform-specific details before comparing results.
Frequently Asked Questions
Q: What types of metrics can I track using Social Planner analytics?
You can track available metrics such as engagement, post reach, impressions, link clicks, followers, and overall social media performance.
These metrics help you evaluate how your content performs across supported platforms.
Q: Is there a way to compare the performance of different posts?
Yes. You can use available analytics reports to review post performance, identify engagement trends, and find top-performing content.
The Top Performing Posts report highlights published posts based on their number of likes.
Q: Can I export analytics data for reporting purposes?
No. The Social Planner Statistics dashboard does not currently provide a direct analytics export option.
Q: How often is analytics data updated?
Analytics refresh frequency varies by platform and metric.
Some platforms have reporting delays of one or two days because of API limitations. Engagement insights for supported synchronized posts generally refresh every 24 hours.
Analytics should not be assumed to update in real time.
Q: Are there any tips for interpreting analytics data effectively?
Focus on key performance indicators that align with your content goals.
Compare similar posts, monitor performance trends, and review changes in impressions, engagement, and reach.
Consider posting frequency, audience behavior, and platform-specific reporting limitations when interpreting results.
Q: What time range can I view in Social Planner Analytics?
The reporting views described in this guide provide weekly performance comparisons.
The Top Performing Posts report displays top posts across available reporting history.